

Youth is wasted on the young. The old are suffering from Peter Pan syndrome. New industry data tells us that GenZs are being left out of the tech industry, not only have companies cut down on internships but headcount reductions are focused on them. Blame AI automation, blame the poor macro, blame NI increases in the UK, blame short-sightedness. Also, in this edition I explore the operational KPIs separating UK and US software to help answer part of the question ‘why are US techs always valued above the UK peers’, and to help investors understand ‘why UK tech companies trade at a discount’. The caveat remains the somewhat contradictory fact that on a case-by-case basis UK techs are valued in line with their US peers, some higher, some lower. It is the company on its own merits that decides valuation, not the venue - a message to Klarna. This is what the data tells us (see below).
Tech Universe results and updates from the past week span Data & Analytics (c3.ai, DocuSign, GitLab, Guidewire, Salesforce, ServiceTitan, UiPath, Zscaler); IT Infrastructure Services (Bechtle); Gaming (everplay); UK Software (Alfa Financial, Cirata, essensys); Internet Services/AdTech (Team Internet); IT Professional Services (Endava); IoT/Smart (Samsara). Read on. Data insights (not navel gazing or ‘vibes’) inform our evolving views on the tech-economy.
The tech drivers and Points to Ponder
1. US (tech) exceptionalism – Strikes back
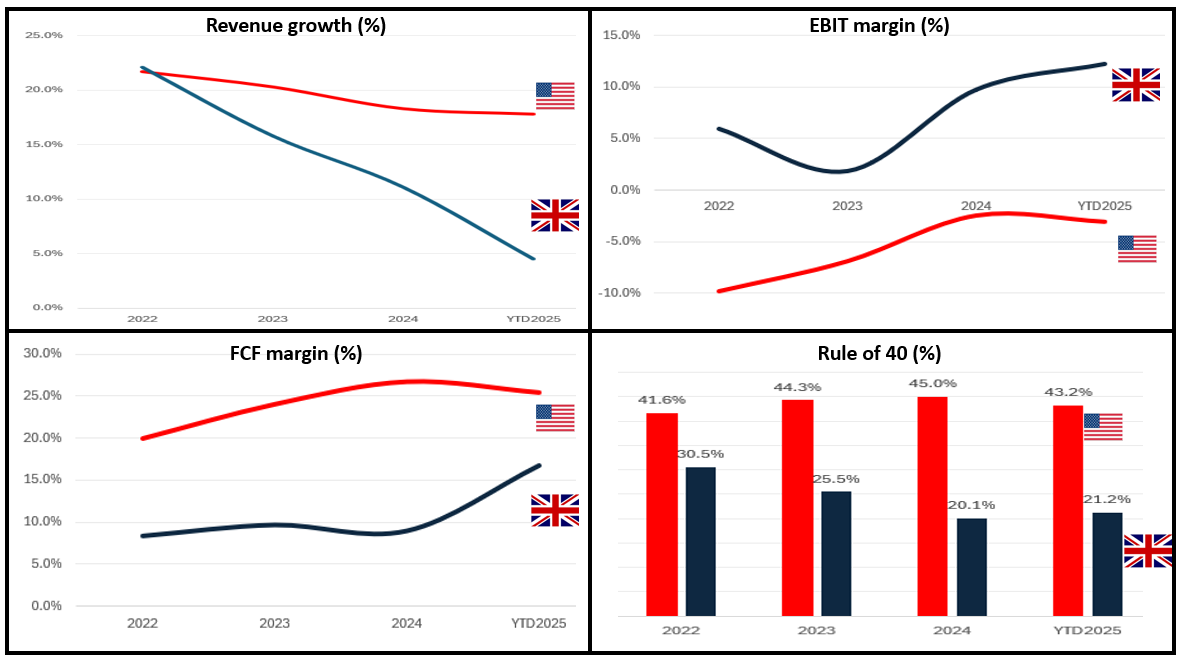
While the topic is widely debated elsewhere in other sectors, for tech at least US exceptionalism continues. Following the latest crop of results I spin up the compare and contrast of some of the operational KPIs looking at UK and US software companies. This is to help answer part of the question; why are US techs always valued above the UK peers? The caveat is that on a case-by-case basis UK techs are valued in line with their US peers, some higher, some lower. It is the company on its own merits that decides valuation, not the venue.
Comparing UK vs US software KPIs
Source: Company data, Technology Investment Services
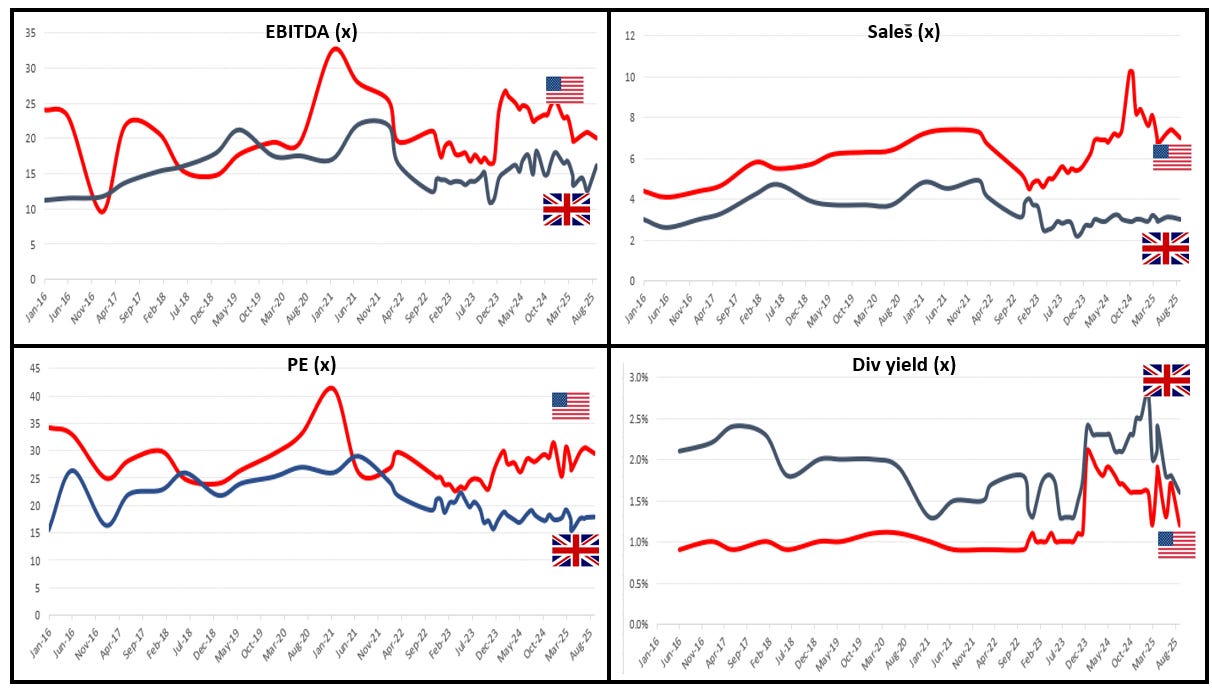
The big picture: US and Them Valuation gap
Source: Company data, Yahoo Finance, Technology Investment Services
But the valuation gap disappears on a company specific basis
Note Priced 8 September pre-market Source: Company data, Yahoo Finance, Technology Investment Services
2.The end of Youth
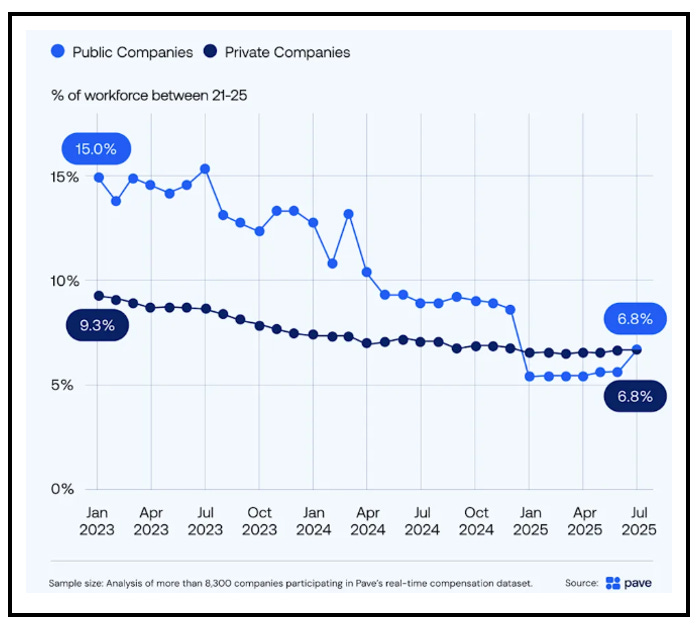
A depressing topic which I have addressed in the past. The mixture of a poor economy and AI automation is squeezing out entry level roles in the tech industry. The percentage of young Gen Z employees (aged between 21 and 25) has been cut in half at technology companies over the past two years. This is according to recent data from compensation management software business Pave who have used workforce data from more than 8,300 companies. This worker cohort accounted for 15% of the workforce at large public tech firms in January 2023; by August 2025, they are 6.8%. Gen Z are digital natives raised on YouTube, Tumblr, Instagram; and now, they’re some of the strongest AI users in their personal and professional lives.
For those with memories stretching back to prior IT industry initiatives. . . I am reminded of the early offshoring era. Looking offshore for staff resulted in the industry failing to hire the next generation of domestic leaders. This presaged a later shortage of IT project management skills and wider IT skill shortages.
Otherwise, after a surge in July (16,292), there were 1,713 tech staff laid off this August, down substantially from 25,944 August 2024. While this is a positive, younger staff are being disproportionately impacted (see below). Note: This topic clashes with the ‘Peak 65’ theme which I have discussed previously.
Percent of Gen Z employees at Tech
Source: Pave
Tech sector layoffs, since January 2024
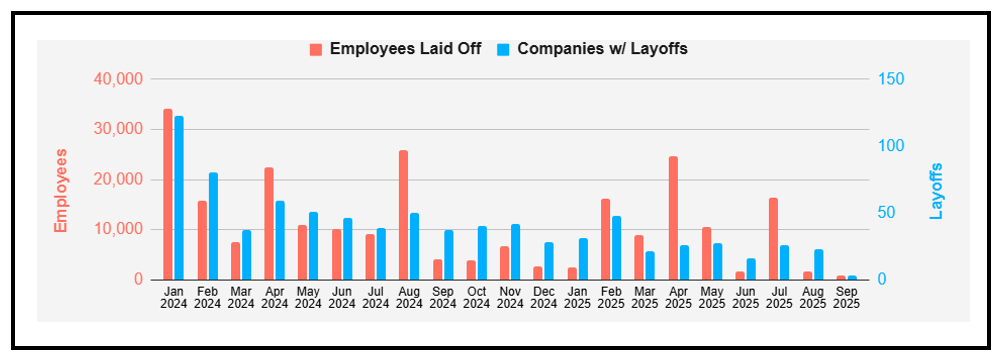
Source: layoffs.FYI
From the Manpower Employment Survey - shifting hiring priorities
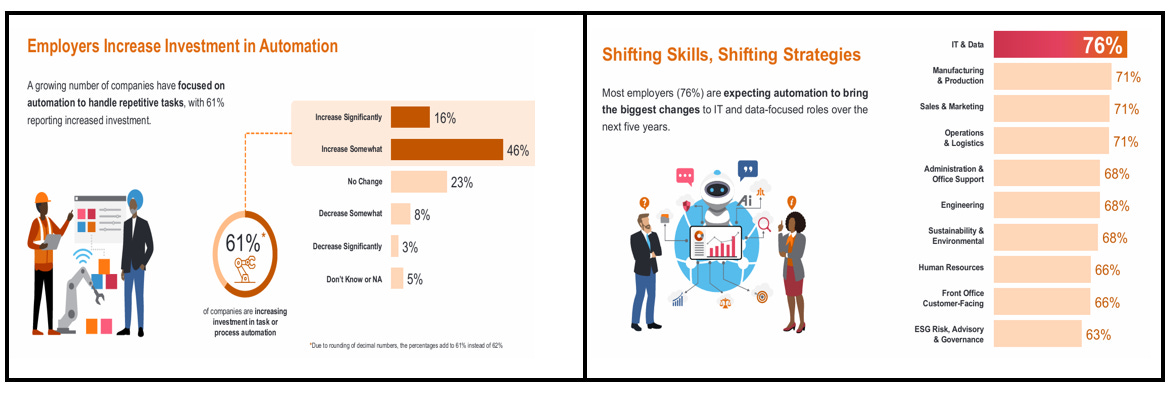
Source: Manpower Employment Survey
Latest results/Company Updates
UK Software
Cohort scenario: Q2 to date has featured good improvements in NRR, FCF margins (a big improvement in DSO with 18 days taken out Y/Y - well done team finance!) and gross profit margin (+268bps) but balanced with ARR, Adj EBITDA margin and revenue growth are all slipping. Our UK company cohort are typically smaller than their US counterparts, but all sell and compete globally. In addition to being smaller they typically have poorer KPIs (notably cash-based, ARR, NRR) but have better profitability. The comparative KPI mix may on its own account for the lower valuation and support the view that ‘venue’ has little to do with the valuation. The group is cheaper and pays a dividend/income in addition to share buybacks.
UK Software cohort: KPI dashboard
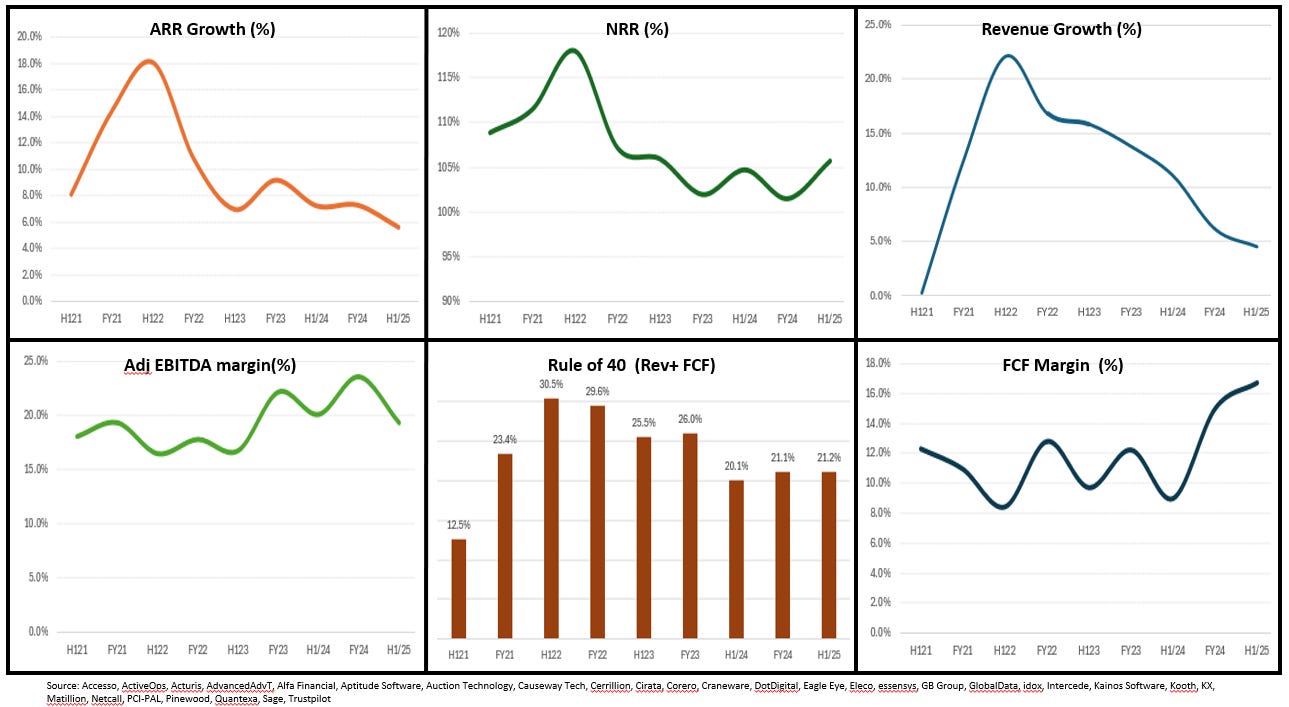
Source: Company data, Technology Investment Services
Alfa Financial. H1 results were in line with prior guidance and the company said that it is “on track to meet” FY expectations. H1 revenue, £62.5m, +20%. This is a blended business with Delivery 50% of Group revenue, Software Engineering (16%) with subscription (34%). ARR +17% to £41.6m which converts to Subscription revenues 34% of total. Alfa guides that this is the cloud revenue. However given that Alfa was an on-prem implementation business and that ‘subscription’ is a financial, not technology, term it could easily include those on-prem users switching purchase from one-time to subscription. There was a 5p Special dividend/share. Operating cash £17.6m, from £13.9m, with net cash £23.9m (30 June) from £20.5m (31 December). The TCV (31/Dec) was due to growth in Delivery and Software Engineering due to pipeline conversion which led to new customer implementation projects and a number of multi-year statements of work. While this was expected to reduce in 2025 (due to delivery). Of the TCV £90m is anticipated to convert into revenue within the next 12 months due to new implementations starting. To support that delivery headcount was +6% Y/Y to 512. Our view is unchanged: Asset finance is counter cyclical.
The numbers we track: Alfa Financial
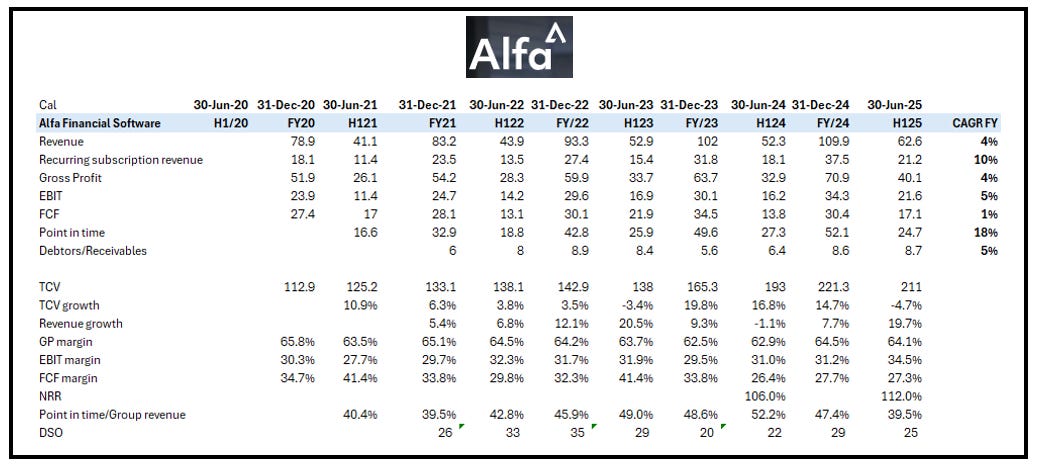
Source: Company data, Technology Investment Services
Cirata. H1 results in line with prior Trading update (i.e. Bookings US$3.8m, DI Bookings US$3.1m). H1 revenue US$4.8m, from US$3.4m, Bookings US$3.8m, from US$2.4m, DI 82% of total bookings value. 70% of continuing revenue is accounted for by two customers. Cash overheads US$8.5m, US$11.8m last year, Adj EBITDA loss US$4.0m vs US$8.6m a year ago. Cash (30 June) US$6.1m with US$1.3m short term receivables, there is also the final consideration “up to US$1.0m” payable in December 2025, as DevOps customers transfer to BlueOptima. The divestiture of the DevOps business combined with a further cut in annualised overheads is expected to bring cash overheads to c.US$12m-13m exiting Q3FY25. There is US$2.0m (US$2.3m last year) deferred revenue from sales booked in H1 FY25 and earlier and not yet recognised as revenue. Management reaffirmed the previous expectation that a working capital fundraise is not required in FY25 as Q2FY25 fell short of Cirata's internal plan as opportunities slipped into subsequent quarters. Positively: Cirata does not have to raise this year; Negatively: Cirata needs a raise. Our counsel: never leave it too late to raise money.
CEO Stephen Kelly is “not satisfied by our speed of execution”. Mr Kelly adds that North America sales fell short relative to plans and has since reorganised go-to-market team with Dominic Arcari appointed as the new Chief Revenue Officer. Mr Arcari has a strong industry reputation, but this is a lot for one guy to do. Mr Arcari challenges must include addressing the paucity of new logo wins both on an absolute basis and via partners. For me, partners should see Cirata as an implementation enabler for their own product (i.e. revenue recognition), rather than seeing Cirata as something that ‘gets in the way’ of sales fulfilment (i.e. ARR). Note:
Hopefully, it is not just the channel management that falls under Mr Arcari’s purview. We note that there are no Cirata product reviews on Azure marketplace, ditto on G2. On Gartner Peer reviews there is one review (22 February, 2019). The user said that the Wandisco fusion monitoring console and admin was “very nice” as they gave it a 4.0 (out of 5.0) for the Wandisco fusion(Replication Hadoop) software.
In the H1 RNS Cirata reminds that it joined Microsoft's ‘ASMP’ where qualifying clients can register for migration to Azure Data Lake Storage ("ADLS") Gen2 for static migration using the Cirata LDM product. I guestimate that ‘ASMP’ refers to the Azure Migration and Modernization Program, usually abbreviated as AMMP, not ASMP as per the RNS. Looking into the topic:
What is ‘static migration’? This is about transferring a fixed snapshot of data which will not sync with any ongoing changes. It is used for one-time moves.
Who wants static? There is no published worldwide figure for the number of enterprises migrating from HDFS/Hive to ADLS Gen2. Azure Data Factory, widely used for such migrations, reports over 11,000 enterprise users worldwide with a significant subset of these is migrating Hadoop workloads to Azure. Major enterprises (finance, manufacturing, retail), including large US banks and multinationals, have migrated Hadoop HDFS/Hive datasets and analytics platforms to the cloud.
Why now? Data migrations could be accelerated by the retirement of legacy platforms (so that could be Hadoop/Hive clusters, Azure Data Lake Gen1), the ‘pull’ would be the cost and scalability advantages of Azure storage, and compatibility with Spark/Synapse analytics workloads, but as I have argued in the past many users will not migrate to the cloud for a variety of reasons.
Is ‘static’ migration just ‘silly’? For archive and regulatory workloads, static migration is common. For operational, customer-facing, or analytical systems, users will want to sync the data. Microsoft classifies static migration as “downtime migration,” and suitable for non-critical workloads, development, or archival systems.
The numbers we track: Cirata
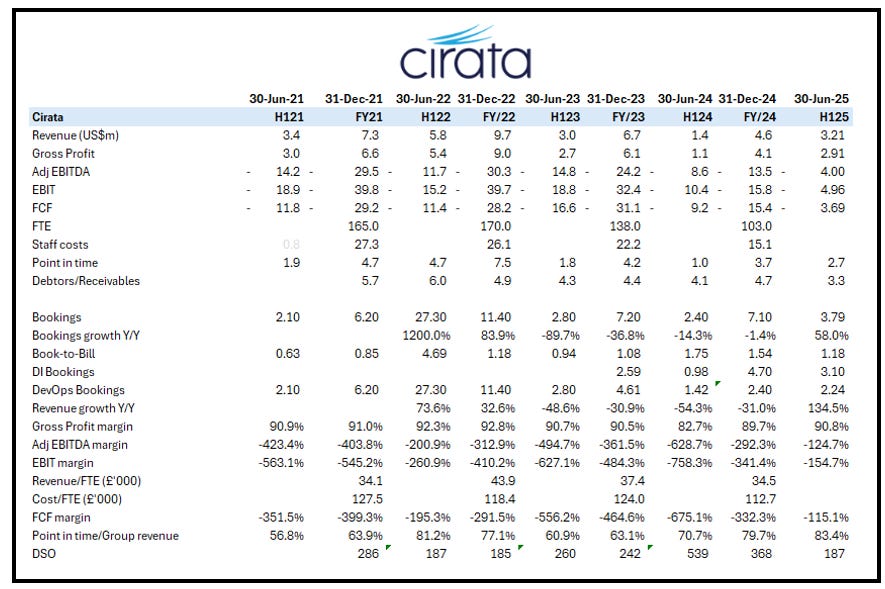
Note: Numbers changed for DevOps sale. Source: Company data, Technology Investment Services
essensys. An FY trading update (ended 31 July) confirms return to profitability at an Adj EBITDA level. FY25 revenue to be £19.2m, down from £24.1m Y/Y, Adj EBITDA “not less than” £1.3m, last year LBITDA £0.9m. Customer churn leads to revenue decline (note the 84% NRR – below) and Essensys has been working on this, and product development. To that end, ‘elumo’ debuted in H2/25; this is a dynamic bookings and access platform so landlords and operators of flexible, multi-tenanted office space can manage and monetise their shared meeting rooms. ‘elumo’ has secured its first sales across all key markets (UK, US, Australia) including a portfolio deal of 20 sites with an existing US customer, and a new logo customer - this is good, short order progress by the GTM team. essensys is in transition to a pure play SaaS model and has completed its FY25 data centre decommissioning project, closing 10 centres in the year as planned, with a further two planned for closure in FY26. The annualised cost savings are £1.5m. There are good structural drivers but this remains ‘wait and see’ unfortunately. CEO James Lowery comments that the company enters the new FY with confidence “in our ability to build on this momentum and deliver long-term value for both customers and shareholders”.
The numbers we track: essensys
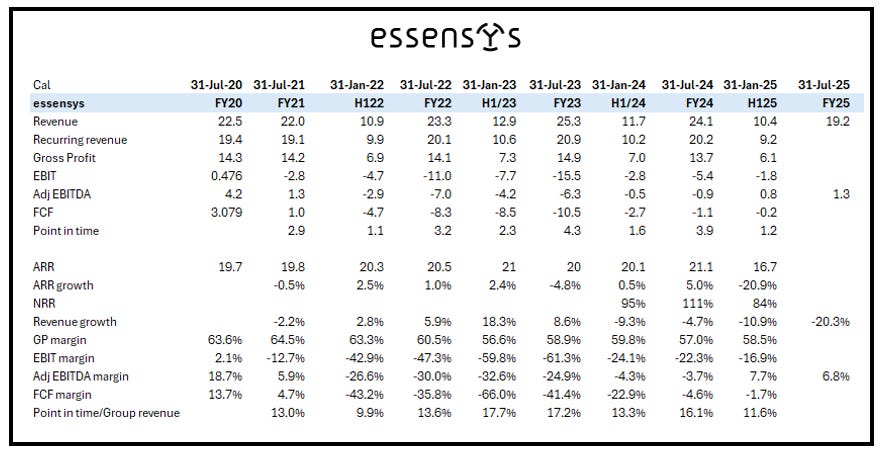
Source: Company data, Technology Investment Services
Gaming
everplay. H1 was lower but company used improving industry data, future release pipeline, back catalogue strength and guidance notes to convince that H2 will be better. From the share price reaction doubters persist. H1 revenue -10% Y/Y to £72.4m, gross profit +2%, Adj EBITDA down to £19.2m, from £19.4m Y/Y. Cash and cash equivalents £59.5m, from £54.328m last year. Revenue was down due to the timings of license revenues and new title launches at ‘astragon’ (expected to reverse in H2), declines in physically distributed sales and the very strong prior year back catalogue. Back revenue declined 15% to £63.5m with contributions from over 140 titles. Positive guidance with the Board expecting FY Adj EBITDA to be “slightly ahead of current market expectations on revenue £173.6m and Adj EBITDA £46.9m”. This follows a “solid” start to H2 2025, supported by the continued strong performance of new releases and the ongoing robust performance of the back catalogue. The company expects c.10 new games for 2025.
The numbers we track: everplay
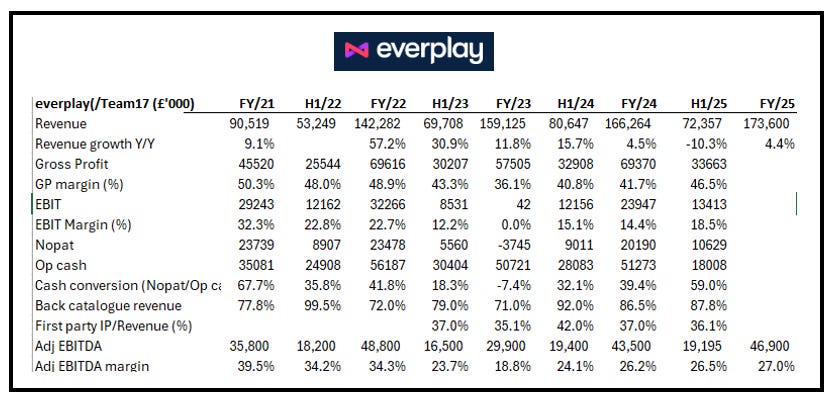
Source: Company data, Technology Investment Services
Internet Services/Ad Tech
Team Internet. H1 results featured revenue, US$263.9m, down from US$409.7m Y/Y, Adj EBITDA US$24.6m down from US$46.6m Y/Y. EBIT was negative US$7.0m from US$22.9m profit last year – the first loss in many years. Net debt US$93.3m (3.8x Adj EBITDA) and after US$6.7m in share buybacks. The share price has understandably crumbled. We like the progress with the new segmental disclosure (see data file) giving the business has greater transparency. The driver behind the collapse is primarily the ‘macro’ level changes in the end market, coupled with the bigger impact on search from AI. While the macro will make new investors cautious in the absence of better data, the Team Internet’s segment view gives investors a better insight to where future issues might lie in wait. From the segments:
DIS: “Unprecedented” number of net contract wins in H1 2025. Contracts become revenue generating in H2 and so provides visibility into revenue growth in 2026 and beyond. Continued double-digit EBITDA growth reinforces DIS as the anchor.
Comparison: “Softened early in H1” and returned to growth towards the end of the period “based on strong answers to the general challenges of search engines”. Guides to a H2-weighted performance in line with normal seasonality.
Search: Currently pivoting social-to-search workflows from AFD to RSOC. RSOC delivers a much richer advertiser and consumer experience, which results in materially higher click prices. Also scaling the commerce media and viral video solutions who grew 160% Y/Y and are 25% of this segment revenue. “Already seeing early signs of net revenue growth compared to late H1 2025”.
CEO Michael Riedl commented that the performance improvement programme is targeting a US$24m reduction in the 2026 cost base versus 2024 (i.e. 200 FTEs to exit). "We continue to optimise and develop each segment, while exploring ways to maximise shareholder returns, including capital allocation and reviewing asset ownership.” A possible nod to selling parts of the business.
The numbers we track: Team Internet
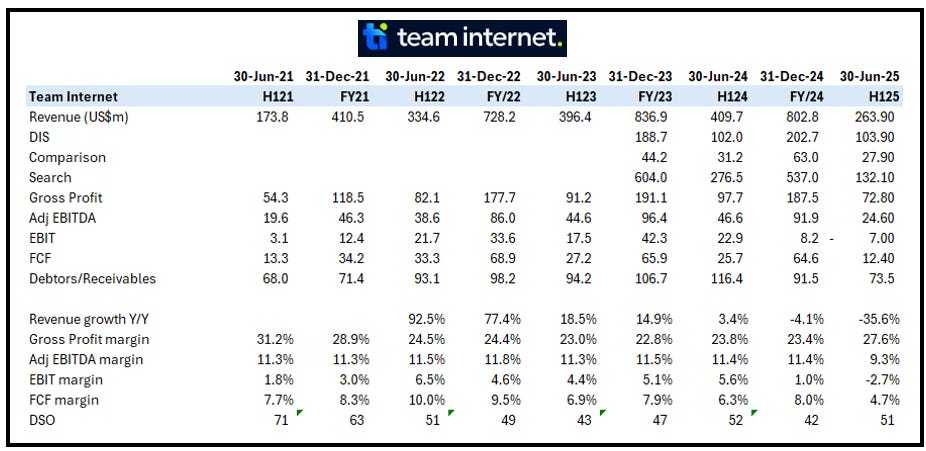
Source: Company data, Technology Investment Services
IT Infrastructure Services
Bechtle. Acquires Dutch IT service provider ITAM Solutions BV. Headquartered in Eindhoven, founded 2007, the company specialises in IT asset management solutions. There are 38 FTEs who generated €4.4m revenue last year. The business will be integrated into Bechtle subsidiary PQR. In total, the Bechtle Group employs more than 800 FTEs in the Netherlands. Simone van Sambeek, founder and CEO of ITAM Solutions, remains with the organisation. ITAM Solutions with PQR means that the group is better able to offer end-to-end support across the IT lifecycle. The purchase price and conditions were not disclosed.
I like this deal. I see a demand-side driver towards Sustainable Consumption and Production, SCP, simply put - the aim to do more, and better, with less and decouple economic growth from environmental degradation, increasing resource efficiency and promoting sustainable lifestyles. Corporates will see that SCP enables them to improve supply chain transparency, efficiency to achieve its business with global consistency and environmental sustainability goals. For me, applying SCP thinking is increasing interest in sustainable management of resources and achieving resource efficiency along both production and consumption phases of the lifecycle, including resource extraction, the production of intermediate inputs, distribution, marketing, and use. From a lifecycle perspective, SCP is also about end of asset life (i.e. stretched beyond the usual three-year financial depreciation) and includes considerations about waste disposal (EU legislation) and the re-use of products and services. EU regulations through the Circular Economy Action Plan are designed to extend the life of IT assets. Also the EU is pushing circular economy principles in trade agreements and international dialogue. I see the management of end-of-life as a secular growth driver/opportunity for those companies who are involved at the outset of the installed product life. If for nothing else, from a buyer perspective think: ‘Fewer throats to choke’.
Data & Analytics
Data & Analytics cohort: KPI dashboard
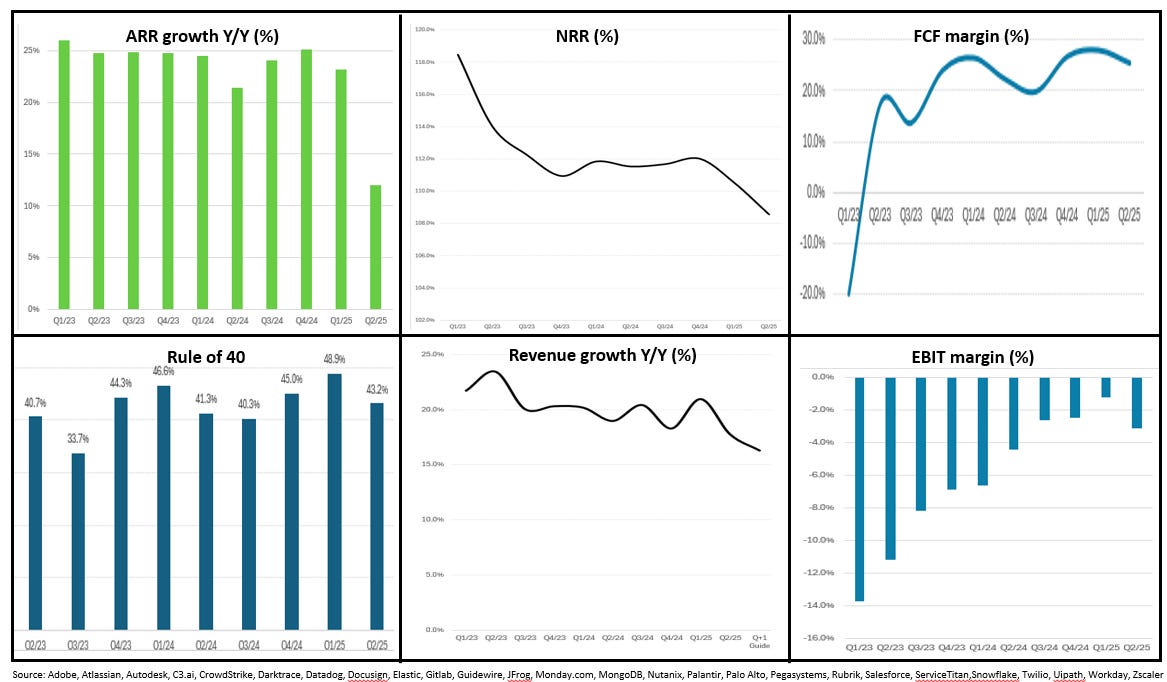
Source: Company data, Technology Investment Services
C3.ai. Q1 revenue US$70.3m termed “unacceptable” (cue: class action) was -35% Y/Y and well below the midpoint of its prior outlook. Subscription revenue was US$60.3m and is now 86% of total revenue, but the gross margin is 38%. The company has US$711.9m in cash and equivalents. The company has restructured sales and services including new experienced leadership “across the board” and has appointed a new CEO. The financial performance was due to the disruption in the sales and services leadership and a number of unanticipated health issues which prevented Tom Siebel from participating in the sales process which is a shame as it suggests that customers are fanboys rather than active buyers. (Confession: I am one of those fanboys. Mr Siebel has an amazing background, here is a nugget: In 2022, Mr Siebel had the highest personal CO2 emissions from private jet use of any American - so he does put in the sales legwork).
In the quarter the company closed nine agreements for C3 Generative AI, including six initial production deployment agreements. On the analyst call there was a rant about the report and how only 5% of LLM pilots are successful with Mr Siebel commenting that the majority of C3 Generative AI deployments are delivering compelling measurable economic benefit. These include: 20% increase in employee productivity; 80% reduction in inspection planning time; 14% reduction in average call center handling time; 85% reduction in procurement contract review time; and 90% labour savings in archive analysis.
The appointment of the new CEO is Stephen Ehikian, effective 1 September. Amongst other software industry roles, Mr Ehikian served as President Trump’s appointee as Acting Administrator of the US General Services Administration, spearheading reforms in federal procurement and technology modernisation, pioneering AI adoption. Mr. Siebel will remain as Executive Chair. We wish you well, Mr Siebel.
DocuSign. A beat and raise with shares +9% following the print. Q2 revenue US$800.6m +9% Y/Y, of which Subscription revenue was US$784.4m, also +9% Y/Y. Management attributed the positive outcome to initial success with go-to-market changes, especially in direct sales and improved customer retention. GAAP gross margin, 79.3%, from 78.9% Y/Y with GAAP net income per diluted share US$0.30 (211m shares outstanding) vs US$4.26 (208m shares) last year. Operating cash US$246.1m (vs US$220.2m Y/Y) made FCF US$217.6m vs US$197.9m last year. Of the business highlights my interest is the Intelligent Agreement Management ("IAM") Platform which saw the launch of new AI-powered IAM capabilities helping customers unlock the value of their agreements “across the entire agreement management lifecycle”. "Q2 was an outstanding quarter, with AI innovation launches and recent go-to-market changes leading to strong performance across the eSignature, CLM, and IAM businesses," commented CEO Allan Thygesen. From the call, there was commentary about accelerate growth in federal government and international markets, leveraging its new GSA partnership and the expanding capabilities of IAM to address complex compliance and workflow needs in these segments.
GitLab. A beat, with FY guidance maintained. Q2 saw revenue,US$236.0m, surge +29% Y/Y with operating cash flow, US$49.4m turn to non-GAAP FCF US$46.5m. GitLab (DevSecOps) platform says it is now a AI-native DevSecOps platform (POV: this is an idea that others should be copying). CEO Bill Staples said that GitLab Duo Agent Platform represents “our vision for human-AI collaboration across the software development lifecycle”. The growth narrative makes a compelling read (in fairness supported by KPIs) as it reflects the transformational value enterprises achieve through the “only cloud-agnostic, model-neutral DevSecOps platform with comprehensive contextual AI capabilities that span planning through deployment, capable of running anywhere, including air-gapped environments”. Similar to the cohort, shares were weak in the aftermath of the print. Yes the unchanged guide led to lower target prices, but mostly it was the news that CFO Brian Robins is departing to join Snowflake.
Guidewire. A beat and raise Q4 with revenue, US$356.6m, +22% Y/Y sending shares to an all-time high. From the segments: Subscription and support revenue US$201.9 m, +33% Y/Y, as license revenue (US$93.6m) grew 5% Y/Y (recap Guidewire was previous generation software); services revenue (US$61.0m) grew 20% Y/Y. GAAP income from operations was US$29.6m compared with US$10.3m Y/Y. While Q4 saw 19 cloud deals and surpassing US$1bn ARR, CEO Mike Rosenbaum said that the highlight was a significant 10-year agreement with a major Tier-1 insurer (ahem - Liberty Mutual) that “exemplified the platform maturity and referenceability”. Like elsewhere with ‘vertical’ software companies, here too Guidewire is developing data analytics and AI-driven tools to improve pricing and claims management for insurers.
Salesforce. 10% Y/Y revenue growth, with cRPO US$29.4bn +11% Y/Y. Salesforce returned US$2.6bn to shareholders and announced a US$20bn increase to it's existing share repurchase program - the total authorized is US$50bn. “We remain on track for fiscal 2026 to be a record year with nearly US$15bn in operating cash flow,” said Marc Benioff, Chair and CEO. “Customers are transforming into agentic enterprises, where humans and AI agents work side by side to reimagine workflows, accelerate productivity, and deliver customer success.” Robin Washington, President, Chief Operating and Financial Officer commented that the company exceeded all our financial targets while “achieving our tenth consecutive quarter of operating margin expansion”. Of note: Salesforce closed 12,500+ deals since launching Agentforce, of which over 6,000 are paid. On help.salesforce.com, Agentforce has handled over 1.4m requests – both very impressive KPIs. Almost forgotten is Salesforce Data Cloud (customers unify their data in a single source) where ARR was +120% Y/Y to US$1.2bn as customer numbers +140% Y/Y. The print was ahead of consensus. However, guidance was below and adding concerns that Salesforce suffers in the AI-natives era (i.e. it is not just the IT Professional Services cohort feeling this pain) shares remain weak.
ServiceTitan. 25% Y/Y revenue growth for Q2 with Subscription revenue +27% Y/Y as FCF surged to US$34.3m, US$18.7m a year ago. The company debuted ‘Titan Intelligence AI’ as it enhanced the product (this enables customers to book, schedule, dispatch, and perform the first fully automated job in the company’s history, and dovetails with the commentary that “the organic pull from customers to fully automate workflow”). Of course, the debut also addressed a key investor concern about the impact of AI-natives in this market. On GTM there is a new partnership with Roto-Rooter - the largest provider of plumbing, drain cleaning, and water cleanup services in North America. Ara Mahdessian, Co-Founder and CEO talked about the opportunity “to transform the lives of every hardworking contractor in the trades” as his Co-founder and President Vahe Kuzoyan commented that the company is “experiencing a change in the large enterprise Commercial market where our multi-year investments are beginning to yield results”. I see these as possibly a nod to the comment on the analyst call that the company is “still early in our S-curve”.
UiPath. Bills itself now as the ‘global leader in agentic automation’ (phew – transition done. Every enterprise software company struggling with the ‘how’ to achieve a similar ‘in one leap Jack was free’ product transition, please take note!). UiPath beat EPS and revenue consensus but the stock, + 0.83% after-hours, has been moribund this year, under-performing the cohort due to the Great AI-Affect (it eats everything). Q2 revenue +14% Y/Y to US$362m, with ARR US$1.723bn +11% Y/Y. positively NRR 108%, flat sequentially and appears to have bottomed for now. GAAP gross margin 82%. Operating cash US$42m making FCF US$45m with Cash and equivalents at US$1.52bn. Daniel Dines, Founder and CEO. "Our continued innovation and best-in-class products are enabling customers across industries to move beyond pilots into production deployments, orchestrating agents, robots, and humans to achieve real outcomes. Customers consistently tell us that automation and agentic AI are stronger together, and with orchestration, they’re delivering real value today while positioning UiPath to lead the next era of enterprise transformation.” That said, commentary from the analysts call is that agentic solutions are not anticipated to significantly impact the top line in FY2026.
Zscaler. Q3 revenue +21% Y/Y to US$719.2m with ARR +22% Y/Y to US$3,015m, billings +32% Y/Y to US$1,202.3m. This was a big win for the products/notion around ‘zero trust security’, the idea that no individual user or device should automatically be trusted, even if it was previously found to be trustworthy. This means that all users' access to various platforms must be verified, authorised, and regularly revalidated. Q4 GAAP net loss US$17.6m vs US$14.9m last year. Operating cash, US$250.6m vs US$203.6m Y/Y, with FCF US$171.9m, 24% of revenue. The printed missed EPS expectations on -US$0.11 vs anticipated US$0.80 but beat revenue with US$719m vs forecasted $707m. The shares have been lower since the print. Jay Chaudhry, Chairman and CEO called it an “outstanding Q4”. The company delivered AI Guardrails for Public and Private apps showing a nice AI portfolio expansion to address the emerging risks of AI models and applications. I like the focus on Agentic Operations (Agentic SecOps and Agentic IT-Ops) where the company reports “continued strong demand” and guides that this portfolio should surpass “US$400m in ARR in FY26”. From the CFO: “We ended FY '25 with over US$3.0bn in ARR, one of only two pure-play SaaS security companies to surpass this level of ARR.” Note: Zscaler is moving from Billings to full-year ARR as its primary growth metric.
The numbers we track: C3.ai, DocuSign, Gitlab, Guidewire, Salesforce, ServiceTitan, UiPath, Zscaler
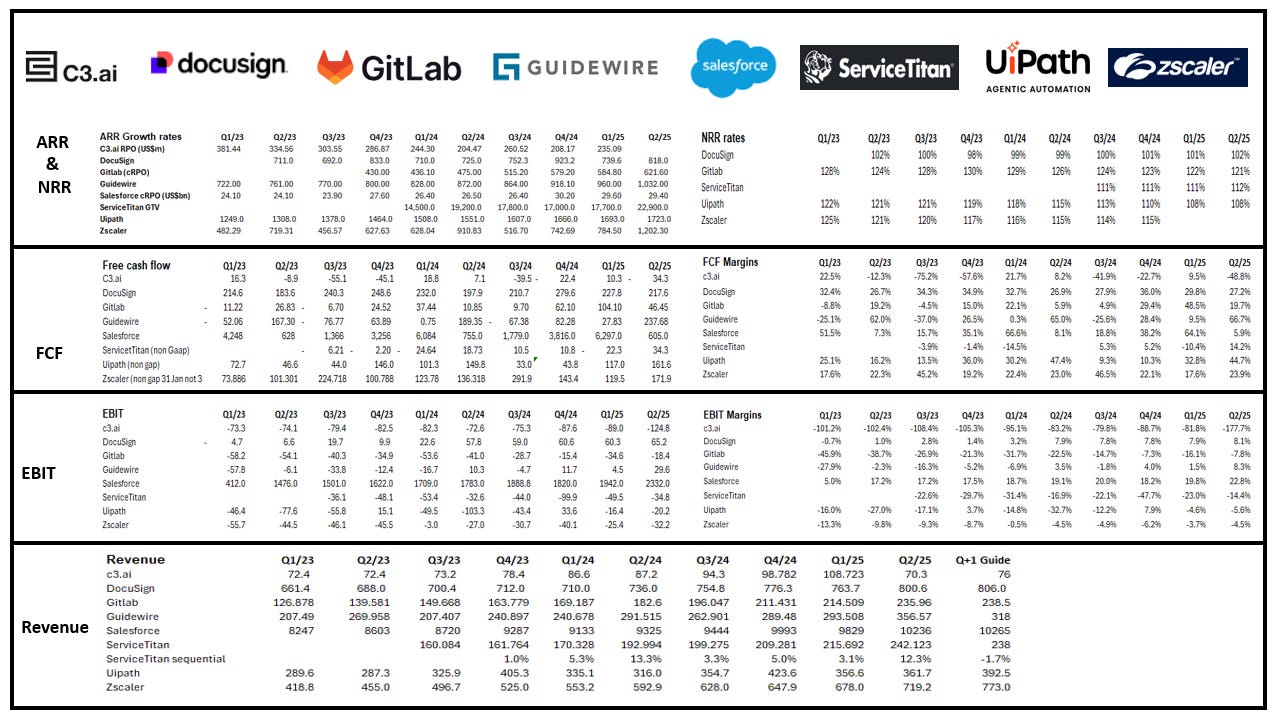
Source: Company data, technology Investment Services
IoT/Smart
Samsara. A beat and raise Q2 where revenue, US$391.5m, soared +30% Y/Y, ending ARR US$1.640bn,soared +30% Y/Y. There are 2,771 customers with ARR over US$100k, from 2,120 one year ago and these customers generated c.US$1bn of ARR, +35% Y/Y. Samsara (Connected Operations/Fleet management) CEO and Co-Founder Sanjit Biswas commented that the company is seeing “first-hand how the rise of the AI-driven economy is amplifying demand for the platform”.
The numbers we track: Samsara
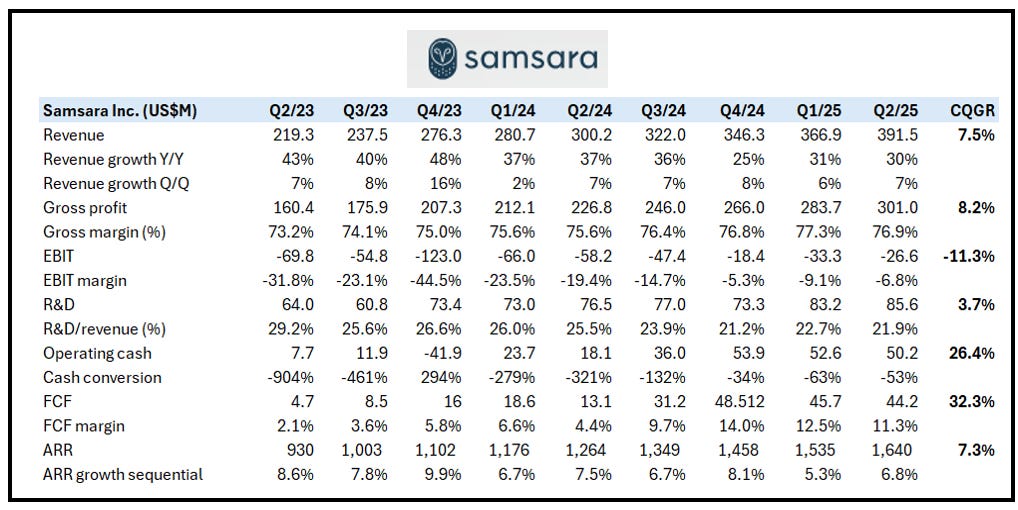
Source: Company data, Technology Investment Services
IT Professional Services
Cohort scenario. The cohort has c.3.6m FTEs, and with Endava (below) all 30 companies have reported Q2. The Q1 KPIs suggested that the recovery was slowly on track with Bookings, revenue, margin and FTE growth. The trend paused in Q2 (Q2 revenue growth 3.64%, vs 6.74% in Q1 and 0.0% Q2 last year ). Bookings continue to recover (B-to-B 1.3x) but FY revenue guidance was lowered through the quarter, now 2.88%. The cohort has had to slowly emerge from the aftermath of the Covid and immediate post-Covid environment which saw the industry over-hire. Since then, staff attrition dried up impacting profitability, attrition is now (Q2/25) 14.3%, from 19.4% last year. The industry has limited pricing power (i.e. inflation clauses). In addition; (i) GenAI has given the industry a new secular growth driver and a new twist to Digital Transformation programs, and (ii) the sector will benefit from increasing Defence spend. Hiring is changing, and with it the staff pyramid, headcount is flat but underlying this companies are favouring more experienced staff and re-training existing ones. The effect being that utilisation is now 84.9% vs the long term (back to 2018) average of 84.3%. Shares in the cohort are cheap reflecting the past two difficult years, difficult macro and the uncertain impact of GenAI on headcount businesses. However as Q2 concluded the dashboard is showing an ongoing improvement in the Productivity Index (183, vs 0.07 a year ago - wow) coupled with the recovery in ROE, currently 9.0%, below the long term average (11.1%) but it came off the bottom several quarters ago.
IT Professional Services cohort: KPI dashboard
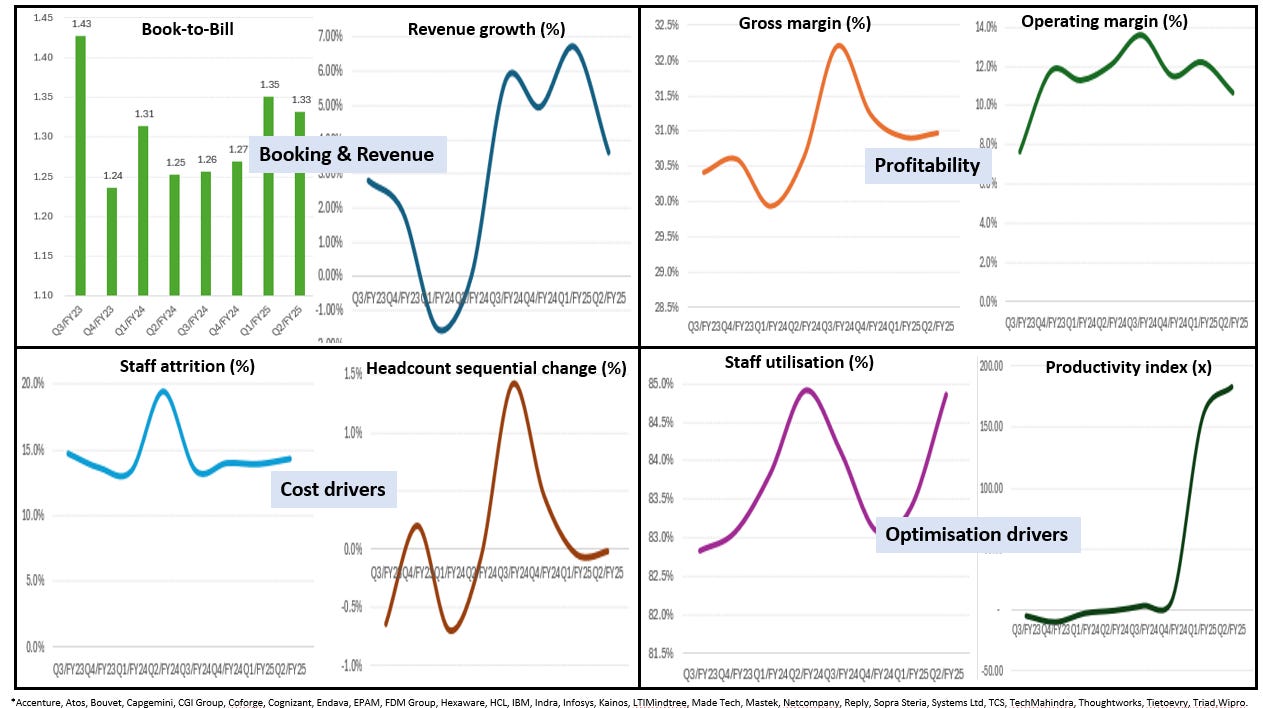
Source: Company data, Technology Investment Services
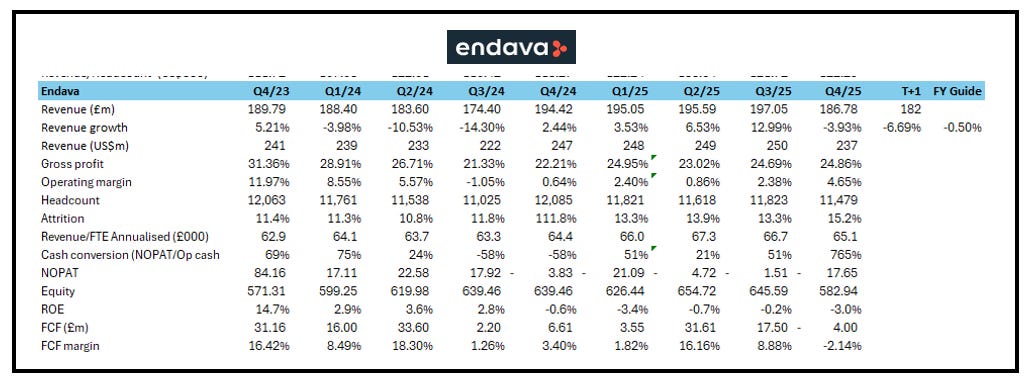
Endava. Q4 revenue, £186.8m, down 3.9% Y/Y. Profit was £1.2m, with diluted EPS £0.02 this compares favourably with last years’ loss of £1.9m and diluted EPS £(0.03). Also positively, Endava exited FY2025 with its highest ever quarterly order book. Adj FCF £(4.0)m vs £6.6m last year. Cash is £48.7m vs £58.4m last year. Note:
Top 10 clients accounted for 37% of revenue in Q4, 34% last year.
38% of revenue from North America (38% last year), 23% Europe (25%), 33% UK (30%), 6% RoW (7%) in Q4 FY2025.
17% of revenue was generated from Payments 19% last year), 22% from BCM (17%), 10% from Insurance (9%), 17% from TMT (21%), 8% from Mobility (9%), 12% from Healthcare (12%), and 14% from Other (13%) in Q4 FY2025.
Great news: Endava is implementing innovative pricing models, such as transaction-based pricing- which many in the industry are assessing as the industry tries to break with headcount (cost plus) based pricing.
Strategic partnerships (such as OpenAI, AWS, Microsoft, and Google Cloud) are contributing to deal flow and delivering new opportunities.
CEO John Cotterell comments that over half Endava FTEs use AI in projects (I’m guessing that all FTEs are using AI) and that this is a “clear marker of progress in our journey to becoming AI-native”. Guidance commentary is that the short term operating backdrop “remains volatile and many clients continue to recalibrate the timing of spending, and therefore our outlook remains cautious”. This is captured in Q1 guidance of revenue range of £181.0m - £183.0m a decrease of between (6.0)% and (5.0)% Y/Y. Meanwhile the FY guidance is for revenue range £750.0m - £765.0m or (1.5)% to 0.5% Y/Y.
The numbers we track: Endava
Source: Company data, Technology Investment Services
Dear investor,
Thank you for reading to the end. Don’t forget to subscribe if you haven’t already!
Join me again soon.
Best wishes
George
End notes & Disclaimer: Please read
All information used in the publication of this report has been compiled from publicly available sources that are believed to be reliable, however we do not guarantee the accuracy or completeness of this report and have not sought for this information to be independently verified. This is not investment advice. Opinions contained in this report represent those of the author at the time of publication. Forward-looking information or statements in this report contain information that is based on assumptions, forecasts of future results, estimates of amounts not yet determinable, and therefore involve known and unknown risks, uncertainties and other factors which may cause the actual results, performance or achievements of their subject matter to be materially different from current expectations. The author is not liable for any direct, indirect or consequential losses, loss of profits, damages, costs or expenses incurred or suffered by you arising out or in connection with the access to, use of or reliance on any information contained herein. The information should not be construed in any manner whatsoever as, personalized advice nor construed by any subscriber or prospective subscriber as a solicitation to effect, or attempt to effect, any transaction in a security. Any logo used in this report is the property of the company to which it relates, is used here strictly for informational and identification purposes only and is not used to imply any ownership or license rights between any such company and Technology Investment Services Ltd. Email addresses and any other personally identifiable information collected in the provision of the newsletter are only used to provide and improve the newsletter.
Need more
Let’s chat at Progressive Equity Research where I am delighted to be a contributing analyst and my website.
The ask
My name is George O’Connor. I am a tech investment and IT industry analyst. I explore shareholder value, its drivers, the best exponents, the duffers. The target readers are investors, companies, advisors, stakeholders and YOU. If you like this please subscribe and pass it on to colleagues and friends. That said, if you hate it - do the same. Thanks for dropping by dear investor.
There are really only two questions we need to ask about Cirata:
1) How much revenue do they need in order to generate at least the US$12-13m so-called 'cash overheads'?
2) Do you believe they will ever get there?