


The long and the short of IT
Deep in the Q3 weeds


We are in the weeds. As we dig around the tech universe, we find many instances of ‘Beat and Raise’ in the Q3 numbers despite the word “challenging” peppering commentary. In a year when half the world's population went to vote, few were as eagerly anticipated as the US election. There, like everywhere else, the incumbent was drummed out. Mr Market responded positively to the forthcoming Trump presidency, yet a more isolationist America increases tariffs and so inflation can re-surface. However, in response US and UK interest rates drifted 0.25% lower, but the UK 10-year remains stubbornly high. That said, our dashboards inform us that many financial and operational KPIs are nudging on an upward trajectory, suggesting that the tech-economy is moving out of the trough. The tech universe has pockets of ‘expensive’ and pockets of ‘cheap’ shares. This will ensure that 2025 is a stock pickers year; yes, geopolitical concerns will continue to weigh, but there is no distraction from an election cycle and the favourable global monetary backdrop suggests that we are at the start of a new economic cycle.
Our latest results roll call includes: Adecco, Airbnb, Alarm.com, Arista Networks, CGI, Datadog, Equinix, Jfrog, Kelly Services, Palantir, S4 Capital, Terranet, Triad, Trivago, Vianet. Read on. Data insights inform our cohort dashboards and views of the global tech-economy.
How the billboards are performing YTD (%)

Note: Priced 8/11. Source: Various, Technology Investment Services
Data & Analytics
Datadog: Beat and Raise
A strong Q3 print from Datadog (cloud monitoring and security platform) saw Q3 revenue grow 26% Y/Y to US$90m. It was ahead of expectations, US$665.1m. In addition, the company raised FY expectations to EPS US$1.75-$1.77 EPS with revenue US$2.656 - $2.66bn. While this was ahead of analyst expectations, the shares drifted lower in the aftermath. Of note: (i) customer base growth, to c3,490 customers generating ARR US$100k – that was up from 3,130 a year ago, and out of 29,200 total customers. (ii) Datadog has cash & equivalents of US$3.2bn. (iii) The company generated FCF of US$204m, a 30% FCF margin. Some comments from the analyst call:
The “overall business environment has remained stable and similar to what we have seen throughout 2024. . . Overall, we continue to see no change to the multiyear trends towards digital transformation and cloud migration, which we continue to believe are still in early days.”
Talking about customer AI adoption the CEO commented: “we see tons of innovation across our customer base but it is still largely more around experimenting and testing new applications”.
JFrog: Beat and Raise
JFrog (DevOps software supply chain management, which it calls “Liquid Software”) posted a strong consensus beating print. The Q3 headline was revenue US$109.1m, +23% Y/Y, consensus was US$105.60m. Cloud revenue +38% Y/Y which was “driven by cloud migrations and security”, cloud revenue is 39% of Group revenue, it was 35% a year ago. Shlomi Ben Haim, Co-founder and CEO said that the results were achieved in a “tight budgetary environment” but nonetheless the company made some of “the largest enterprise wins in it's history”. From the numbers, here too strong on cash with operating cash U$27.6m and FCF US$26.7m helping Cash & Equivalents grow to US$467.8m. Of note: To further its ‘platformisation’ agenda, JFrog announced several strategic initiatives, including the expansion of its platform with MLOps and Runtime Security, and collaborations with NVIDIA to enhance machine learning model security.
Palantir: Beat and Raise
A beat and raise with 44% Y/Y revenue growth. “We absolutely eviscerated this quarter, driven by unrelenting AI demand that won’t slow down. This is a U.S.-driven AI revolution that has taken full hold,” said (a shy and retiring) Alexander C. Karp, Co-Founder and CEO. Palantir is a US government ‘play,’ which is strong in defence and intelligence agencies, (revenue in US government was +40% Y/Y and the sector accounts for 44% of total revenue – the US itself accounts for 69% of Group revenue) and it has used a similar approach to UK market entry - being involved in Borders and NHS/Covid tracking. However the private sector is also gathering pace with US commercial revenue +54% Y/Y, +13% sequentially, and is now just shy of a quarter of total revenue. Says Alex: “As America once again forges ahead, our allies and partners in Europe are being left behind. Their private and state institutions stand on the sidelines during this pivotal moment in economic history, while the relentless innovation of U.S. companies disrupts and reshapes global industries.” Of note: (i) the customer count grew 39% Y/Y, and (ii) Adj. FCF US$435m, 60% margin. Palantir raised FY guidance: revenue to between US$2.805 - $2.809bn, Adj income to between $1.054 - $1.058bn, Adj. FCF guidance “to in excess of US$1bn”.
The numbers we track

Source: Company data, Technology Investment Services
Dashboard thoughts
It is too early in Q3 reporting in the Data & Analytics segment to draw meaningful cohort-wide conclusions. From the past two weeks, the cohort is in ‘beat and raise’ mode, and concerns about their budget being poached for AI adventures have eased. Overlaying the valuation means that investors are likely to want to see the cohort ‘grow into their valuations’ – rather than being more cautious that the companies are victims of having ‘their’ budget continually siphoned off as GenAI POCs turn to inference, hence the product imperative around debuting AI extensions.
Data & Analytics Dashboard

Source: Company data, Technology Investment Services
IoT
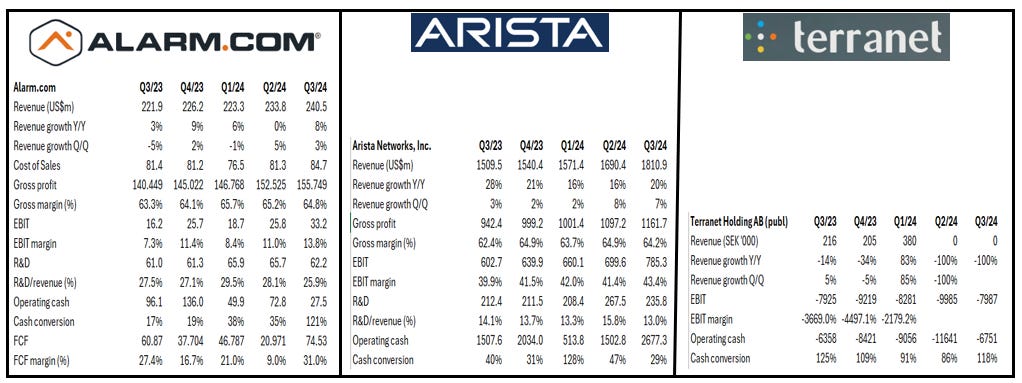
Alarm.com: Beat and Raise
Alarm.com (intelligent connected property) reported Q3 Y/Y revenue growth of 9.8% to US$159.3m but Adj EBITDA was +21% Y/Y to US$50.0m. Of note, EBITDA beat consensus, US$41.69m, by 20%. In addition to beating the quarter, the company also raised FY guidance. FCF margin was 31%, up from 9% in Q2. Cash & Equivalents increased to US$1.17bn, from US$697.0m at 31/12/2024, the growth due to a US$500.0m convertible. Note: There was a slew of product intros spanning Cameras, Video Monitoring and Smart Thermostats, and these will help future expansion rate sales. As to revised guidance: FY revenue expected to be in the range US$933.7 - $935.9m. This includes hardware and other revenue in the range US$305.0 - $307.0m and SaaS and license revenue in a range US$628.7 - $628.9m.
Arista Networks: Beat and Raise
Arista Networks (client-to-cloud networking for large AI, data center, campus and routing environments) reported Q3 revenue US$1.811bn +20.0%Y/Y (consensus was US$1.75bn) with gross margin, 64.2%, vs 62.4% Y/Y and EPS $2.33 vs US$1.72 Y/Y. “Arista remains at the forefront of next generation centers of data across client-to-cloud and AI focused locations,” said Jayshree Ullal, Chair and CEO. From product debut we note the rise of the AI centre has created greater demands on modern open networking and in this Arista has developed a portfolio of form factors which scale from single-chip systems to modular multi-chip, multi-tier networks that scale out to thousands of XPU ports. The 7700R4 Distributed Etherlink Switch offers simplicity and scalability with a cost-effective and power-efficient solution for the AI Center. Shares have been very strong this year and following the print were -7% in afterhours (7/11). The move was not just ‘sell on the news’ as gross margin guidance was a concern. Q4 gross margin guidance was down sequentially to between 63% and 64% as Q4 revenue guidance, US$1.85 - $1.9bn was ahead of consensus. There was in addition news of a 4-for-1 share split, the split-adjusted trading set to start on 4/12.
Terranet: No revenue & no CEO
Terranet is in development mode with no revenue reported in the past six months, and Q1 revenue was from Vinnova, the Swedish innovation agency. We learn that the Terranet core product BlincVision is now able to function as an independent driver assistance system, and with autonomous braking the system has, for the first time, completed the entire chain: from detecting and classifying objects to calculating collision risk and initiating an emergency brake that brings the vehicle to a stop. The company is also developing a Proof of Concept with a “global car manufacturer or major supplier” and the “preparatory activities have begun” with the promise that in Q4 it will move from the planning stage to integration into the partner's vehicle. Looking into 2025 the company guides that it will develop an MVP in H1 paving the way for “upcoming volume agreements”. In addition, on 14 October, Terranet announced that CEO Magnus Andersson would leave in early 2025.
Vianet: Trading Update
Vianet (250k+ connected machines IoT, software platforms and insights) issued a Trading update (6 months to 30/9). H1 revenue £7.69m, £7.19m last year, Recurring Revenue 84% of total 87% year ago, Gross Margin 67%, 69% a year ago. Adj operating profit +10.1% Y/Y to £1.43m. Operating cash £1.92m, £1.28m last year helping to reduce net debt to £1.0m (H1 2024: £2.09m) and cash £2.25m (H1 2024: £1.32m).
Of the operational highlights:
Expansion into the forecourt sector where there are “promising opportunities among manufacturers and retailers”.
The Unattended retail division is undergoing a product transition from 3G-to-4G and this has led to a “substantial pipeline” for 4G LTE readers, but the slow pace of 3G shutdown by mobile network operators has “impacted short-term pipeline conversion”. The anticipated 3G network shutdown, initially anticipated for December 2024, is now expected in summer 2025.
The Hospitality division posted a 7.3% year-on-year revenue increase, bolstered by several long-term contract renewals and new client wins.
Ongoing collaborations with Fintech and Oxford Partnership are enhancing growth prospects in the hospitality sector in the UK and US.
Chair and CEO James Dickson: "We are witnessing a notable improvement in the Group's performance, driven by our strategic investments in sales, technology, new market verticals, and expanded product lines. Our collaboration with Suresite, alongside the recent exit of a competitor is creating substantial new opportunities within the unattended retail sector, particularly in expanding our market share and subscription revenues.”
The numbers we track
Source: Company data, Technology Investment Services
Dashboard highlights
Our IoT companies span a variety of functional areas (home, transport, driving, security). In each segment there are tailwinds from a macro wrapper (usually legislative) which supports the IoT use cases. The end markets are driven by positive tangible use cases but demand has been slower for a variety of reasons. While the investor attention caravan has moved on to GenAI, generally as we are mid-way through the 5G cycle, the underlying technology is more robust, cheaper, more available and so we think that this cohort is still headed in the right direction in creating shareholder value.
IoT Dashboard

Source: Company data, Technology Investment Services
IaaS
Equinix: 87th Quarter of Consecutive Revenue Growth
Q3 revenue +7% Y/Y was a combination of “robust pricing, strong deal conversion rates and meaningful billable cabinet improvement” results in a beat and raise. Of the numbers: (i) Adj EBITDA, US$1,048m +1% sequentially and 48% margin, (ii) AFFO US$866m down sequentially due to higher recurring capital expenditures. Raised guidance to revenue range US$8.748 - $8.788bn (i.e. +7% Y/Y and an increase of US$36m viz prior guidance, Adj EBITDA range US$4.086 - $4.126bn (implying 47% margin) and +US$10m viz prior guidance, AFFO range US$3.338 - $3.378bn,+ 11 - 12% Y/Y and +US$18m viz prior guidance.
Adaire Fox-Martin, CEO and President: “We see continued robust demand for AI-enabling digital infrastructure from a highly diverse set of customers of varying sizes, industries, and regions.”
Capex Growth:
Equinix has 57 major projects underway in 35 markets across 22 countries representing more than 22,000 cabinets of retail capacity and more than 100 megawatts of xScale capacity to be delivered through the end of 2025.
Earlier this month, Equinix announced plans to nearly triple the capital invested in its xScale data center portfolio with the agreement to form a greater than US$15bn JV, subject to closing conditions, with Canada Pension Plan Investment Board (CPP Investments) and GIC, with whom Equinix has previously partnered on xScale projects in Asia, the Americas and Europe.
Equinix's global xScale portfolio continues to see strong demand and leasing activity as the need for hyperscale infrastructure to support AI and cloud initiatives continues to grow.
The numbers we track (US$m)

Source: Company data, Technology Investment Services
Dashboard highlights
This cohort will continue to report strong growth, leaving investors to fret about future CapEx obligations leading to depreciation concerns next year. The IaaS cohort has positive tailwinds from cloud and AI migration, but also that native cloud apps ‘work’ on cloud platforms forcing the migration. There is also a counter-cyclical element (i.e. when CapEx for compute and store is tight there is usually more flexibility in OpEx). While the hyperscalers seem to generate the column inches the participants span a wide variety of companies.
IaaS Dashboard
Source: Comany data, Technology Investment Services
IT Professional Services
CGI: Flags M&A
It was FY results at CGI. François Boulanger, President and CEO: “Looking ahead to fiscal year 2025 . . our financial strength deepens our position as an active consolidator.” The numbers included 4.4% Y/Y revenue growth to US$3.66bn, Adj EBIT $600.2m, margin of 16.4%. Operating cash $629.1m, 17.2% of revenue. Bookings $3.82bn, 104.4% book-to-bill. Note: (i) the BtoB is 109% for the last twelve months, (ii) of the Booking number Extensions, renewals and add-ons accounted for 70% of the total, with the 30% balance being new business. The core client segments are Government (38% of Group revenue) and Financial Services (22%) with the key regions being US (32% of group revenue), Canada (15%), France (15%) and the UK (12%) - note this is where Logica, CMG and Admiral all ended up. The company has pivoted more to Managed Services & BPO (56% of Group revenue) with the balance, Business and strategic IT consulting and SI services (44%).
CGI: The numbers we track (CAN$)

Source: Company data, Technology Investment Services
Triad: Cloud clears
Triad has been lost in a mist for years. Triad is a niche UK Public Sector T&M company with c 130FTEs. But Triad just surprised with a very positive H1 print (to 30/9). Among the financial highlights: H1 revenue £10.21m from £6.39m last year, Gross profit £2.97m from £0.95m a year ago making a Gross profit margin of 29.1% - so getting to respectability. PBT, £0.75m, reversed the £0.99m loss last year. Cash increased to £2.88m, so plus +£0.26m on last year. The 2p dividend was unchanged Y/Y. Chair Dr John Rigg was in optimistic form stating that the results “have been achieved organically without resorting to a dash for growth at all costs, or compromising in any way our fundamental boutique business model”. He also flags his support of “the new Government in its welcome drive to apply the benefits of digital technology to efficiency and cost control”. The new FY year is built “on the back of a record-breaking series of contract wins which necessitated significant recruitment to satisfy client demand”. Triad recruited 18 people in FYQ4 and since recruited a further 24, giving a tally of 133 technology specialists at the end of the half-year. The skills span enterprise architecture, software engineering, quality assurance, business analysis and cloud technologies. As to guidance: “The second half looks set to continue in a similar vein, bolstered we anticipate by an increase in opportunities following the settlement of it the Government's spending plans.” Welcome back Triad.
Dashboard thoughts
The majority of our KPIs turned positive a quarter or so ago, and the momentum was maintained thru Q3 - yet the companies remain cautious and without the aggregated view investors are not able to discern the general improving trend. The cohort is not without challenges (notably pricing, and the spending pause of 2024) and concerns that President Elect Trump will force a wider ‘re-shoring’ agenda, thereby impacting the pricing pyramid for US headquartered IT Professional Service companies. To re-iterate our view: the most challenging time is not the start of a downturn, nor the middle, but the start of the recovery period when growth needs cash as it is at its weakest. At the recent Capgemini analyst conference call there was a general distraction as to what growth rates are in the IT Services market and questions about hiring into growth and productivity. There is a general ‘dont know’ about. To put some data on it: From Q3 results to date IT Professional Service companies responsible for c3.3m FTEs out of our c3.5mFTE IT Professional Services universe have reported; Q3 revenue is +4.6% Y/Y (reported), from 2.3% in Q2. The operating margin is 14.4%, from 12.1% in Q2 and up from 12.8% this time a year ago. There has been hiring as the cohort starts to re-build after a number of years of downsizing. They do this cautiously as they are re-building order books and FTE utilisation, now 85.2%, from 84.5% in Q2 and 82.8% this time a year ago. Short term hiring has depressed our Productivity Index but it has improved of late and hiring is a welcome sign of confidence in the outlook. It somewhat provincially supports our view that we are at the trough and at the beginning a new economic cycle.
IT Professional Services Dashboard

Source: Company data, Technology Investment Services
Recruitment
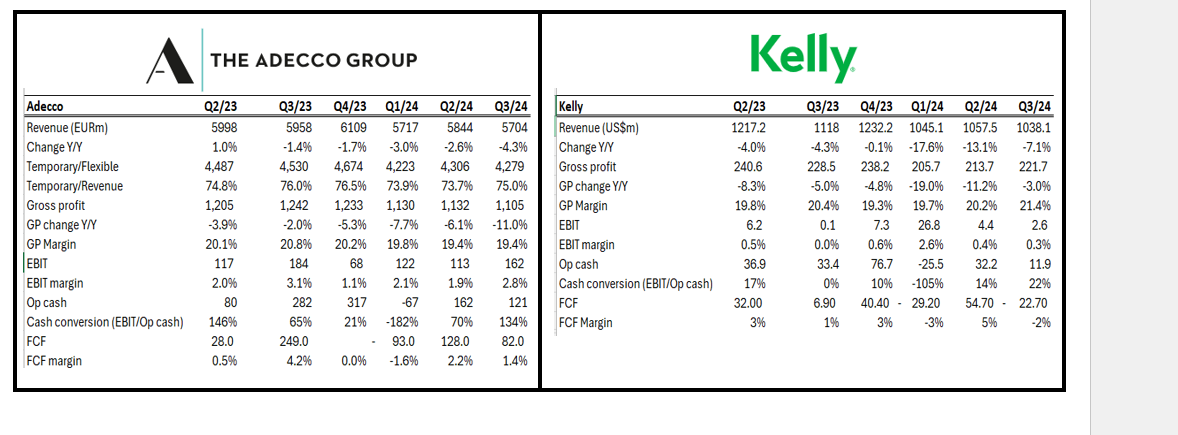
Adecco: “Volume trends stabilising”
Shares dipped on the print which was shy of expectations and there were wider concerns about the dividend given the net debt – for us, these seem over-blown. Q3 financial highlights include: (i) Revenue -5% Y/Y, shy of consensus, (ii) Good results across Asia, Iberia, EMEA, LatAm outweighed by challenging markets, particularly in France, US; Akkodis -5%, (iii) 19.4% gross margin, sequentially flat, reflecting lower volumes, current business mix, firm pricing, (iv) Operating profit €162m was -12% Y/Y but ahead of consensus, €153m, 3.3% EBITA margin, (v) Operating cash flow +€121m and Free cash flow €117m YTD. CEO Denis Machuel commented: “The macroeconomic environment remains challenging, but I am encouraged to see that volume trends have stabilised. . . We remain focused on capturing market share, building on strong progress over the last two years, and have positioned resources to capture growth opportunities as the market recovers.” As to the outlook: Adecco said that volumes stabilising throughout Q3 and in October 2024 and so for Q4 it guided for revenue, gross margin and SG&A expenses ratio to be “similar” to Q3 2024. Adecco added that it is increasing G&A savings while protecting sales and delivery capacity to capture growth opportunities and market share.
Kelly Services: Stable revenue (again)
The print missed consensus. While Q3 revenue, US$1.04bn, was down 7.1% Y/Y this followed the sale of European staffing operations, excluding that Q3 revenue was -0.2%. Q3 adjusted EBITDA margin increased 20 basis points to 2.5%. Peter Quigley, President and CEO commented that this was the second consecutive quarter of stable revenue despite the “continued impact of customers’ more guarded approach to hiring, initiating new projects, and backfilling open roles”. “Contributing to this trend is continued double-digit revenue growth in Education, expansion into the market for higher-margin outcome-based solutions in SETT and P&I, and sequential stability in MSP and RPO revenue in OCG. We expect to build on our momentum as we close the year, propelled by our growth and efficiency initiatives which are positioning Kelly to capitalize when staffing demand rebounds and continue delivering above-market performance.”
The numbers we track
Source: Company data, Technology Investment Services
Dashboard highlights
Recruitment is one of the front-end indicators of the Tech universe. All companies are mindful of the challenging headwinds yet are better able to execute following their 2023 restructuring initiatives. As seen from the dashboard the KPIs have started to budge the right way. In addition, hiring intentions started to improve a quarter ago, but it has not led to widespread hiring, and it is an unknown whether AI will follow the ‘Jevons Paradox’: i.e. improved efficiency drives greater demand for, rather than replacing, technology resources. However, there are indications that week-on-week progress is telegraphing that the conditions have stabilised. Despite strong valuation support, investors will likely need ‘handholding’ as they consider when to buy the trough when many others remain ‘fearful’.
Recruitment Dashboard

Source: Company data, Technology Investment Services
Travel-tech
Airbnb: Beatish and Raise
Airbnb beat Q3 revenue, but profit was a miss to consensus. Shares fell 4% afterhours on the news. Revenue +10% Y/Y to US$3.7bn, net income US$1.4 bn, Adj EBITDA US$2.0bn, +7% Y/Y and a 52% margin, from 54% last year. Operating cash was US$1.1bn with FCF US$1.1bn, from US$1.3bn and US$1.3bn respectively a year ago. The company has US$11.3bn Cash & Equivalents. Chair, CEO and Co-Founder Brian Chesky commented that “we are off to a great start in Q4 2024. We are seeing strong demand trends in Q4 2024 across core and expansion markets for both long and short lead times.” This dovetailed into guidance which was raised to Q4 revenue range US$2.39 - $2.44bn (but the midpoint was in-line with consensus), FY Adj EBITDA margin c35.5% with the FCF margin guided to be “several points above our Adj EBITDA margin”.
From the details:
Nights and Experiences Booked accelerated through Q3 and into Q4. This was despite a softer start due to shorter booking lead times compared to 2023, however there was a “modest” increase in Average Daily Rate. Growth has been partly driven by the Airbnb app with nights booked on the app +18% Y/Y in Q3 and now App bookings account for 58% of total nights booked, 53% last year.
Here too we have evidence of the travel-tech cohort budging closer to ‘Social’ as we see how the feature set is evolving. We note the early success of Airbnb new features for; (i) group travel, including shared wishlists, a new messages tab, and trip invitations. The percentage of bookings from shared wishlists “have nearly tripled” and contributed to over 1.2m new app downloads and more than 1.7m new user sign-ups. (ii) The debut of Co-Host Network. Here the idea is to help people find the best local hosts to manage their Airbnb. This is to make the Airbnb app more personalized, along with over 20 host upgrades based on their feedback.
Over the Paris Olympics c700k guests used Airbnb and an increase in supply of c35% in the Paris region, helping EMEA ADR +6% Y/Y in Q3. At Group level ADR was US$164 in Q3, +1% Y/Y.
Trivago: Not going out
Q3 revenue was -7% Y/Y to €146.1m, but there was some growth in branded traffic channels (Developed Europe and Rest of World) while in Americas the company suffered from “temporary unfavorable market conditions”. Q3 Adj EBITDA €13.6m signaled that the company was trending closer to its FY guidance of breakeven Adj EBITDA levels as the company also guided that it was “optimistic” that it can return to Y/Y revenue growth in Q4.
Caution: Advertiser Concentration. Trivago generates the majority of its Referral Revenue from online travel agencies. For brands affiliated with Expedia Group, including Brand Expedia, Hotels.com, Orbitz, Travelocity, Hotwire, Wotif, Vrbo and ebookers, the share of Referral Revenue was 36% and 38% for the three and nine months ended September 30, 2024, respectively, viz 34% and 37% Y/Y. For brands affiliated with Booking Holdings, including Booking.com, Agoda and priceline.com, the share of Referral Revenue was 40% and 39% during the three and nine months ended September 30, 2024, respectively, compared to 46% and 43% Y/Y.
The numbers we track

Source: Company data, Technology Investment Services
Dashboard thoughts
Travel tech lapped the 2019 year (i.e. the pre-Covid times) late in 2023, and for many the concern now is whether the cohort can sustain spring-back momentum following ‘The Great Vacation’. In addition there are structural headwinds around sustainability in the travel industry, both from the demand and supply side, which is not to ignore the ill-effects global warming is having on the travelling public. While the dashboard illustrates the spring-back potential we see another turn of the investment case - OTAs are, like Airbnb and Hostelworld, beginning to look more like ‘social’ sites (in time this will alter the KPIs to track, but in the short term we wonder whether this changes the cost ratios). To begin to reflect this we have amended our Dashboard to on-board some Social KPIs so we can observe their dynamics (below). We think that the big opportunity is in increased OTA profitability over time (Social spends less on Sales and Marketing due to a bigger viral effect) with continued strong cash generation.
Travel-Tech Dashboard

Source: Company data, Technology Investment Services
Internet Services & Adtech
S4Capital: Battling on
Q3 Trading Update featured revenue, £198.4m, was -15.2% Y/Y – a move which reflected “lower activity in both Content and one of the larger Technology Services clients”. Positively, new business activity continues at significant levels with a particular focus on AI-driven hyper-personalisation at scale. Guidance was updated to; FY like-for-like net revenue “to be down low double digits” and Operational EBITDA to be “slightly below the prior year”. Net debt, £180m reflects 2.2x EBITDA so well shy of the covenant, 4.5x EBITDA. With the FY net debt level re-iterated as in stated range of £150 to £190m. Of the positives; we note that Billings £481.6m, +7.0% Y/Y. From the segmental revenue disclosure: Content revenue was £131.0m down from £160.9m, Data&Digital Media £47.3m, from £49.6m Y/Y, Technology Services £20.1m, from £35.4m last year. Net revenue by Geography: Americas £138.5m. -17.4% Y/Y, EMEA £30.4m, unchanged, Asia-Pacific £10.4m, -23.0%.
The indefatigable Sir Martin Sorrell, Executive Chair commented that the quarter marked the continuation of the H1 trends namely; “challenging global macroeconomic conditions and high interest rates, as well as some underperformance when compared to our addressable markets”. These impacted marketing spend by technology clients while the Technology Services practice was affected by a reduction in one of the larger client relationships (this was previously flagged). On a positive note, Sir Martin added that the company continues to capitalise on its “prominent AI positioning” and is seeing “multiple initial AI related assignments as clients start to use our MonksFlow tools and our experience to implement applications”. The three newly introduced Go-To-Markets - Orchestration Partner, Real Time Brands and Glass Box Media – “are all starting to resonate with clients". Sadly the erosion of the AdTech market seems to have abated at the Googe/Meta level but this has not filtered down to the smaller company level. Investors may well be tired of the wait.
End notes & Disclaimer: Please read
All information used in the publication of this report has been compiled from publicly available sources that are believed to be reliable, however we do not guarantee the accuracy or completeness of this report and have not sought for this information to be independently verified. This is not investment advice. Opinions contained in this report represent those of the author at the time of publication. Forward-looking information or statements in this report contain information that is based on assumptions, forecasts of future results, estimates of amounts not yet determinable, and therefore involve known and unknown risks, uncertainties and other factors which may cause the actual results, performance or achievements of their subject matter to be materially different from current expectations. The author is not liable for any direct, indirect or consequential losses, loss of profits, damages, costs or expenses incurred or suffered by you arising out or in connection with the access to, use of or reliance on any information contained herein. The information should not be construed in any manner whatsoever as, personalized advice nor construed by any subscriber or prospective subscriber as a solicitation to effect, or attempt to effect, any transaction in a security. Any logo used in this report is the property of the company to which it relates, is used here strictly for informational and identification purposes only and is not used to imply any ownership or license rights between any such company and Technology Investment Services Ltd. Email addresses and any other personally identifiable information collected in the provision of the newsletter are only used to provide and improve the newsletter.
Need more
Let’s chat at Progressive Equity Research here where I am delighted to be a contributing analyst and my website here.
The ask
My name is George O’Connor. I am a tech investment and IT industry analyst. I explore shareholder value, its drivers, the best exponents, the duffers. The target readers are investors, companies, advisors, stakeholders and YOU. If you like this please subscribe and pass it on to colleagues and friends. That said, if you hate it - do the same. Thanks for dropping by dear investor.