


The long and the short of IT
Kainos, FD Technologies: The case for Oil and Water


Final results from Kainos (20 May) and FD Technologies (21 May) feature two companies with split personalities. At Kainos T&M is 81% of Group revenue, software is 15%, at FD Technologies T&M is 68%, software 32%. Both companies arrived at this destination differently: Kainos started life as a T&M in DX for UK Public Sector, FD was a Capital Markets T&M provider. Both got the software bug which abducted the gene pool. Plenty of software companies start by productising a bespoke service - but this is not an easy pivot: Software and Tech Services have different cash flows, different cultures, different R&D profiles, different GTM methodologies, different life cycle models. Just plain different. Kainos is all about developing software products for the Workday (sizeable and global) customer base. At First Derivatives software is a suite of vector database products very neatly positioned for GenAI adoption. Kainos celebrates diversity, FD Technologies is splitting into the components. Valuation is recovering in the T&M segment (see below) as KPIs turn better, even if forecasts are still trending downwards. Simply put, folks are cautious, but appreciate that Election Years are habitual one-offs and after the usual hiatus there is a ‘get back to normal’ effect. As we update our T&M IT Services kpi dashboard let’s review these prints.
Kainos messages in the print
Worry beads were out ahead of the print (20 May), but in the end unnecessarily so, the results were ‘okay’, cash was very strong and International is 39% of revenue. The shares rallied +17% on the day despite plenty of cautions and earnings downgrades.
The highlights
Kainos recorded its 14th consecutive year of growth at final results (20 May), where revenue increased by 2% to £382.4m, but common with the T&M industry, Kainos T&M revenue at Digtial Services slipped 5% Y/Y. Adj PBT grew 14% to £77.2m a healthy 20% margin. The backlog grew 11% to £357.1m and year-end cash was a very pleasing £126.0m, £108.3m Y/Y (time for a special div?). As to the divisions: Workday-related product revenue grew 28% to £57.3m, ARR+26% Y/Y to £60.5m. The latest product to debut is the Employee Document Management product which since last October has become “our most successful product launch”, with 26 clients already contracted.
Note: (i) Healthcare sector revenue -11% Y/Y to £44.2m, (ii) Commercial sector revenue -19% Y/Y to £30.8m, Public sector is 36% of total. (iii) International revenue +13% Y/Y to £149.8m, to 39% of Group revenue (a supr reseult) (iv) Kainos has 2,995 FTEs, 2,990 Y/Y as it reduced contract staff (42 from 209 Y/Y). Note Technical staff at 2,354, 2,322 Y/Y. (v) Retention 93%, 88% Y/Y. (vi) Customer count 930 (2023: 821).
GenAI “remains largely experimental” and projects are often delayed by the challenges of low data quality for organisation-specific use cases. Kainos has trained 500+ FTEs in the use of Generative AI and over 30% of projects are using co-pilots to assist in accelerating development pace.
CEO Russell Sloan:
“Despite the ongoing global economic uncertainty, we believe that our largest business areas, Workday Products, Workday Services and the public sector segment of Digital Services, will continue to be resilient and will offer substantial growth opportunities in both the near term and medium term. We are well positioned within these markets, both locally and, increasingly, internationally, and we remain confident in our strategy.”
We flag:
We backcast from the reported numbers to see how the T&M results may have been achieved. This gives an insight into the operational pressure points. We allocate headcount by revenue/geography. Common with the cohort we increased staff utilisation, but to achieve the reported numbers we lowered day rate assumptions. On the conference call management acknowledged price pressure. Given the UK market in public sector remains weak thru 2024, plus the lack of unplanned staff attrition, we anticipate that utilisation dips in the year ahead.
Gap Analysis: Kainos vs the wider peer group
All participants suffer from low staff attrition which given falling revenue will impact utilisation in the year ahead.
Book to bill is recovering across the cohort.
Declining productivity, a function of staff and revenue change, is similar to Kainos and the wider sector.
Since Q3/22, Kainos EBIT margin has bested the cohort, and for the latest reported period its T&M revenue decline has been shallower than the peers. While Gross margin is mixed across participants there is a general trend of fewer contractor staff which helps COGS, same as for Kainos.
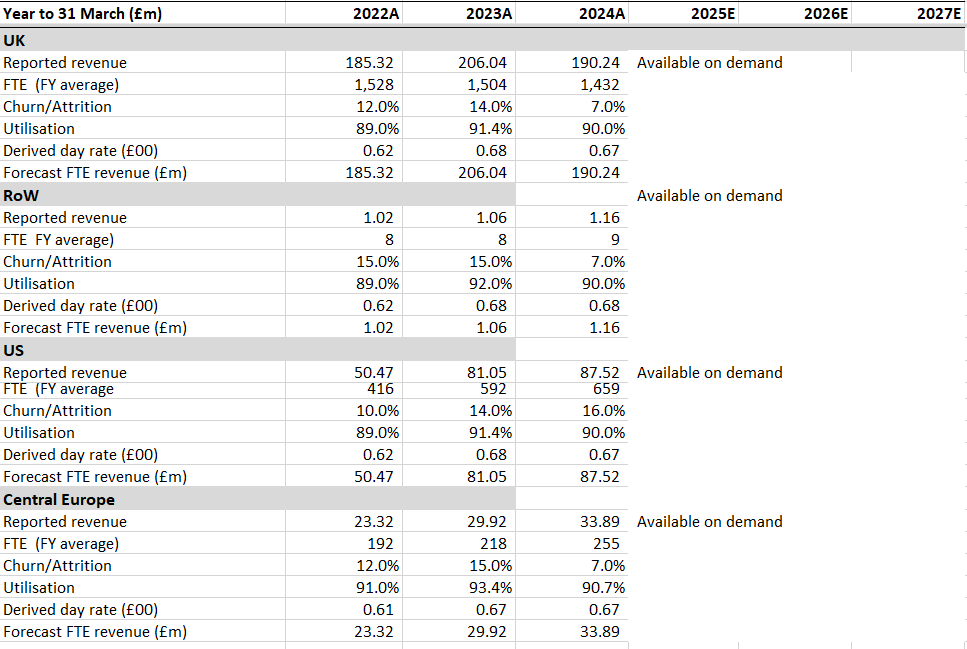
A note for theorists, revenue/FTE at Kainos is one of the highest of the cohort. This is a function of the Kainos staffing pyramid and location. Cleary this puts the company under a disadvantage in more challenged economic times, yet staying niche helps the company but gets harder to maintain as it grows. Having an offshore footprint helps on blended cost models, note Kainos now has c90 staff in India.
All participants have been winning GenAI related revenue. It is to soon to say with any certainty if there are winners and laggards at this juncture or who has the better offer.
FD Technologies: FY results
FD Tech is splitting into its component parts. Operationally GenAI is a demand feeder for the KX vector database division with the First Derivative division is T&M company which has suffering similarly to the wider T&M cohort, but with the added annoyance of the slowdown in the capital Markets customers. It can be sold without too much difficulty – but timing doesn’t particularly work for selling shareholders. That said, CEO has a long-established track record in generating shareholder value – he can be trusted. The GenAI division, KX, is an exciting early-stage pure play database business, doing best in class on mindshare (DBEngine 7.55), engineering kudos (4.8 on G2), playing a role in cause & effect analytics, but is early in the product life cycle of GenAI. We take encouragement from; (i) the correct GTM channels, (ii) continued technical leadership in the core technology (iii) upped the product insertion rate in 2023/4, (iv) deployment friendly features added and (v) New senior hires.
No surprises from the print which featured Group FY revenue -2% Y/Y to £249m, gross profit flat and Adj EBITDA down 31% to £23m due to a combination of accelerated investment in KX plus lower revenue in First Derivative. Net debt £14.4m (FY23: £3.7m). The divisions:
KX: Super-fast technology insertion hastens the pivot from engineering to sales-led
FY Revenue grew 12% Y/Y to £79m (FY23: £71m), led by recurring revenue up 19% to represent 86% of total KX revenue (FY23: 81%). 12% ARR growth to £73m; with recurring revenue +19% and is 86% of KX revenue, 81% Y/Y. FY performance impacted by lower pipeline conversion rates and lengthened sales cycles due to “having fewer repeatable use cases in newer markets” (i.e. not productised) and macroeconomic headwinds. Positive product insertion rate: (i) debuted KDB.AI, a vector database for real-time contextual AI. This enjoyed initial sales a number of key technical wins with major existing and potential customers. (ii) Launched kdb Insights offerings with Microsoft, AWS, GCP, Databricks and Snowflake – these are the right channels to market. (iii) Released kdb+ 4.1, the first major release in four years – clearly 4 years is too long in a fast-moving segment. (iv) Best is a host of deployment friendly features, language interfaces and tooling including Python, SQL and also Visual Studio Code – developers d not have to go thru hoops to use the technology. Early results are positive as native Python-first interface, 'PyKX' has 150k+ downloads. (v) Positive new hires in Chief Revenue Officer, Chief Marketing Officer and Chief Product & Engineering Officer.
First Derivative: Usual T&M dynamics, here too a message of no further deterioration
FY Revenue -8% Y/Y to £170m due to “increased spending caution among customers”, since taken measures taken to control costs and improve efficiency, enabling Adj EBITDA margin to be maintained. Areas of demand for our domain and technology skills mitigating lower spending on general technology skills within our customer base and leaving us well positioned when demand improves. Bookings improved in Q4 but the “market remains cautious”. First Derivative revenue of £170m, down 8% (FY23: £184m), driven by continued customer caution resulting from lower investment banking revenues. Note: Company transferred professional services contracts (£9m) relating to post implementation consultancy and development from KX to First Derivative. We acknowledge that FD is a better home and positively this should ensure an umbilical cord between the divisions, beyond term-based service & support contracts. On the analyst call a general message that Q4 bookings were the strongest Quarter with a good start to FY25 – still a tough market. The share price is -5% currently.
Group structure review
In March 2024 the Board announced that it had concluded that the separation of its three businesses. Next steps:
March 2024 that the Group had agreed an all-share merger of MRP (the Martech division) with CONTENTgine. FD Technologies owns 49% of the merged entity, reported as discontinued operations in FY24 and reported as an associate investment in future.
The final step in the process is the separation of KX and First Derivative. Advisers have been appointed (oh dear) and further updates as appropriate.
Seamus Keating, CEO of FD Technologies:
"FY24 presented challenges within our businesses but we made significant strategic progress and we enter FY25 with clarity and focus on the exciting opportunities ahead. While KX's ARR growth was below our expectations for the year, we have addressed the operational challenges and are well placed to execute on the enormous addressable market in the industries we are targeting. First Derivative managed its cost base to ensure that despite the caution in its customer spending, it maintained margins. In the early months of FY25, the market has remained subdued but with stable activity levels.”
Current trading and outlook
KX is expected to achieve ACV added in the range of £16m to £18m in FY25, resulting in gross ARR growth of 20-25%. There is a pipeline of repeatable use cases in capital markets, aerospace and defence and high-tech manufacturing. Churn c 8-10%, driven by the renewal rate of solutions sold in prior years, before returning to normal range of 5-7% from FY26. Cash EBITDA in line with FY24, with positive cash EBITDA FY27. H1 FY25 has started positively.
The data
IT T&M Services dashboard
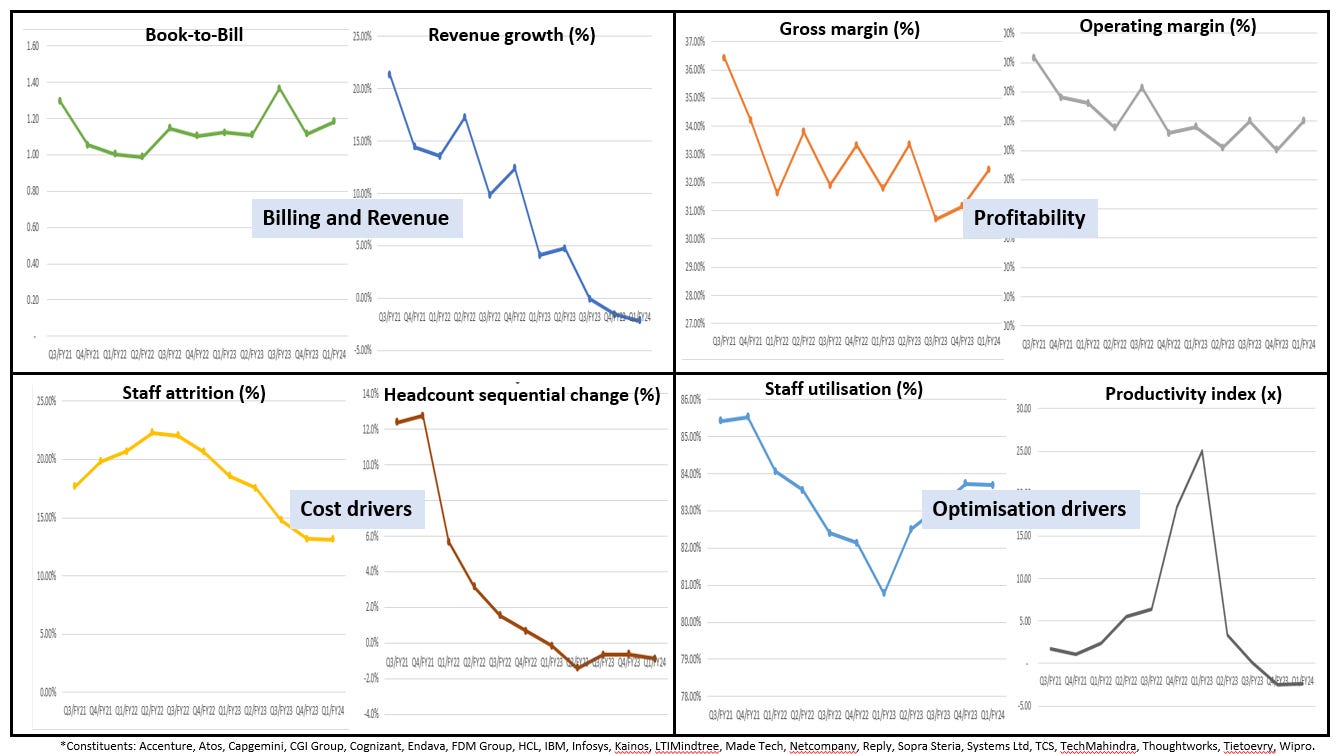
Source: Company data, Analyst (George O’Connor)
Kainos: KPIs
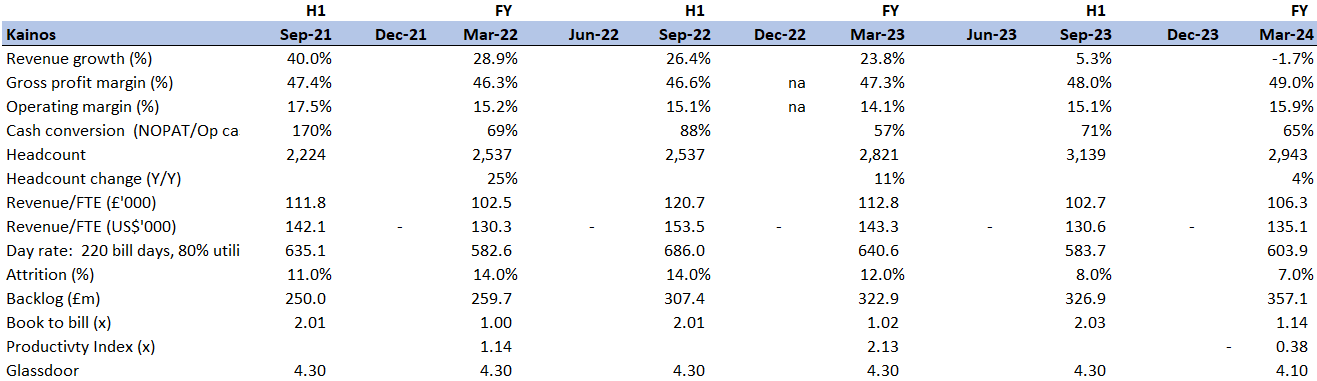
Source: Company data, Analyst (George O’Connor)
Kainos: Backcasting the T&M numbers
Source: Company data, Analyst (George O’Connor)
IT T&M Services: Selected Revenue/head (US$000)

Note: Exchange rates at 20 May. Source: Company data, Analyst (George O’Connor)
Valuation heatmap

Source: Company data, Factset, Yahoo Finance, Analyst (George O’Connor)
T&M valuation over time (handy for pricing up First Derivative)
Source: Factset, Yahoo Finance, Analyst (George O’Connor)
End notes & Disclaimer: Please read
All information used in the publication of this report has been compiled from publicly available sources that are believed to be reliable, however we do not guarantee the accuracy or completeness of this report and have not sought for this information to be independently verified. This is not investment advice. Opinions contained in this report represent those of the author at the time of publication. Forward-looking information or statements in this report contain information that is based on assumptions, forecasts of future results, estimates of amounts not yet determinable, and therefore involve known and unknown risks, uncertainties and other factors which may cause the actual results, performance or achievements of their subject matter to be materially different from current expectations. The author is not liable for any direct, indirect or consequential losses, loss of profits, damages, costs or expenses incurred or suffered by you arising out or in connection with the access to, use of or reliance on any information contained herein. The information should not be construed in any manner whatsoever as, personalized advice nor construed by any subscriber or prospective subscriber as a solicitation to effect, or attempt to effect, any transaction in a security. Any logo used in this report is the property of the company to which it relates, is used here strictly for informational and identification purposes only and is not used to imply any ownership or license rights between any such company and Technology Investment Services Ltd. Email addresses and any other personally identifiable information collected in the provision of the newsletter are only used to provide and improve the newsletter.
Need more
Let’s chat at Progressive Equity Research here where I am delighted to be a contributing analyst and my website here.
The ask
My name is George O’Connor. I am a tech investment and IT industry analyst. I explore shareholder value, its drivers, the best exponents, the duffers. The target readers are investors, companies, advisors, stakeholders and YOU. If you like this please subscribe and pass it on to colleagues and friends. That said, if you hate it - do the same. Thanks for dropping by dear investor.