


The long and the short of IT
Tech Sector economics: The curate’s egg


Into the Q2 end we tap-tap and break into our macro data. The sector has some good points, some not so good ones: runny and hard. In this edition we highlight an array of data points spanning: those persistent Tech sector lay-offs, hiring intentions from Manpower, Glassdoor, Tech worker vacancies and the ongoing salary pressure. We show Gartner’s upward revision to IT spend forecasts, but the subsequent reduction in UK GDP growth estimates stymied wider enthusiasm. But there is enthusiasm. To wit: Our ‘Sell in May’ investment thesis came a cropper as FTSE Techmark index is +4.2% since May to 17 June. Sector TSR +9.15% YTD vs -7.8% cal2023. Sector valuation nudges better (FY1 P/E 18.3x, vs 16.7x for May). Corporate news saw Salesforce shares hit hard (-17%, 29 May) on a revenue miss and guidance which trailed consensus. There appears to be some ‘bloat’ among enterprise buyers but this marked GenAIs first warning. In the ensuing panic we reviewed software sector NRR, FCF and ARR . . . and breathe. In the UK, Raspberry Pi shares are +57% on its IPO prompting us to ask ‘how have tech IPOs performed’? Tracsis warned on election delaying spend (forgivable), but also squeezed in a mention of US problems. Today (18 June) we have a storming set of FY results from Intercede, and a so-so SThree H1 Trading update. We look forward to news of the Darktrace acquisition where shares languish well below the offer (US$7.75/share). Despite a miserly undisturbed premium (20%) and the absence of any white knight, it is rare for shareholders to vote against a ‘bird in the hand’. Line up the soldiers, read on as we peck at the sector data points.
The data
Sector layoffs persist, and salaries drift lower
Message in the chart: Tech sector lay-offs remain persistent (40.9k Q2TD, vs 57.2k sequentially, 46.4k Y/Y). The pressure on tech salaries remains, but the free-fall eased and UK June full-time rates (£56.9k) saw a sequential rise, 0.5%. This first sequential increase since September last. All help sector profitability.

Source: Layoff.fyi, ITjobswatch.co.uk, Technology Investment Services
Job openings and hiring intentions
Message in the chart: Hiring intentions remain lower Y/Y with the Manpower NEO 22% unchanged sequentially, -6% Y/Y. Tech worker vacancies saw a sequential rise to 211k (14 June), from 168k. This morning SThree H1 update saw net fees -7% Y/Y with Permanent -18% Y/Y. This doesnt capture the moves to work staff pyramids and the re-tooling for GenAI.

Source: trueup, Manpower Employment Survey, Technology Investment Services
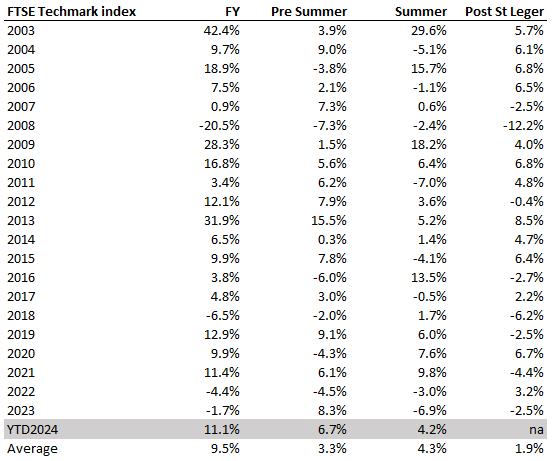
‘Selling in May’ blatantly not working so far
Message in the chart: In a traditional ‘Sell in May’ sector, this summer has seen a strengthening Techmark Index, which is feeding a more general enthusiasm for the sector. The FTSE Techmark index is +4.2% since May to 17 June. There is greater awareness that the UK is cheap, but importantly there is share momentum.
Source: Yahoo Finance, Bloomberg, Technology Investment Services
IT Spend forecast, by Gartner Group
Message in the chart: The first increase in IT spending forecast by industry analysts Gartner, with IT spend forecast increased from 6.8% to 8% Y/Y largely because Enterprises are funneling more money into consulting rather than internal staff.
Source: Gartner Group
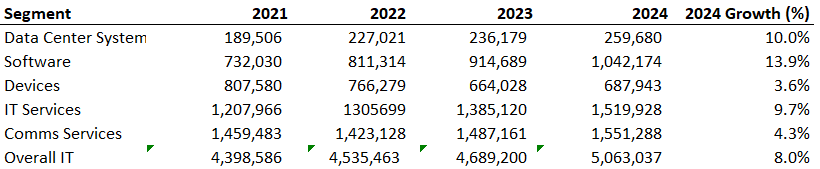
IT Services dashboard
Message in the chart: Comments by Gartner about a strengthening IT Services market is not evident from the revenue growth rates being reported by the IT Services cohort - here revenue growth rates continue to slip.

Source: Company data, Yahoo Finance, Technology Investment Services
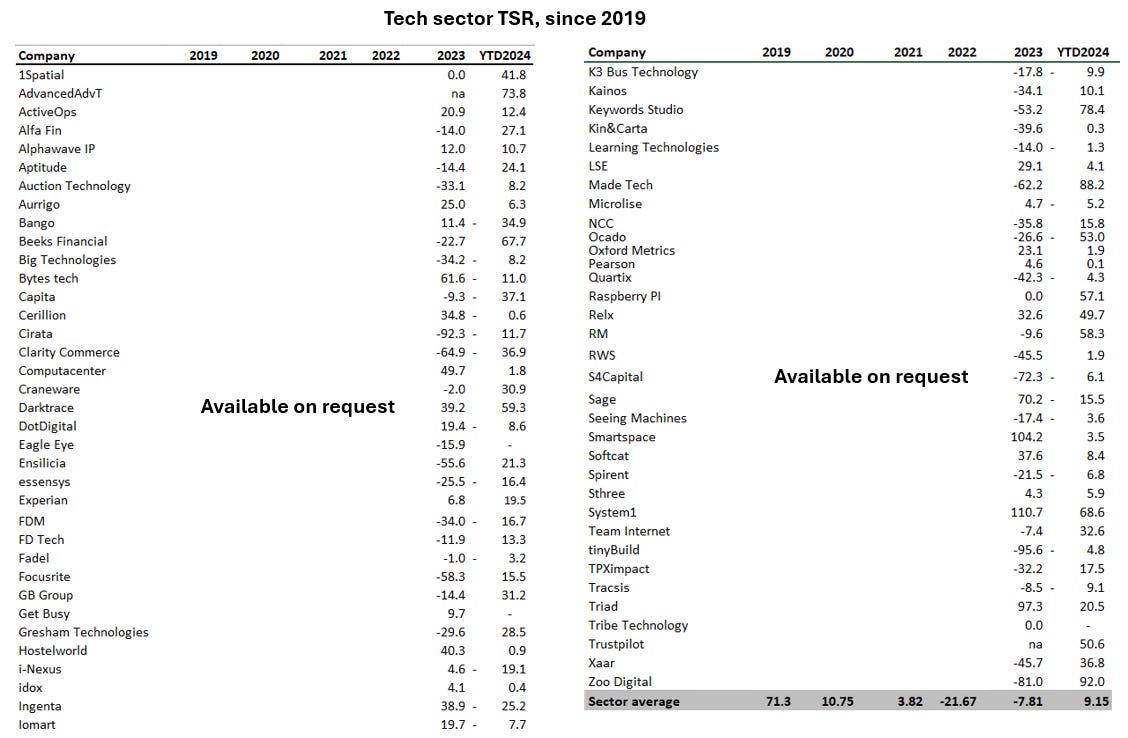
Sector TSR, since 2019
Message in the chart: Sector TSR, +9.15% YTD, compares favourable to the -7.8% in cal2023. Raspberry Pi shares are +57% on its IPO. We said farewell to LoopUp another AIM exit, and today (18 June) we look forward to news of the Darktrace acquisition.
Source: Yahoo Finance, Bloomberg, Technology Investment Services
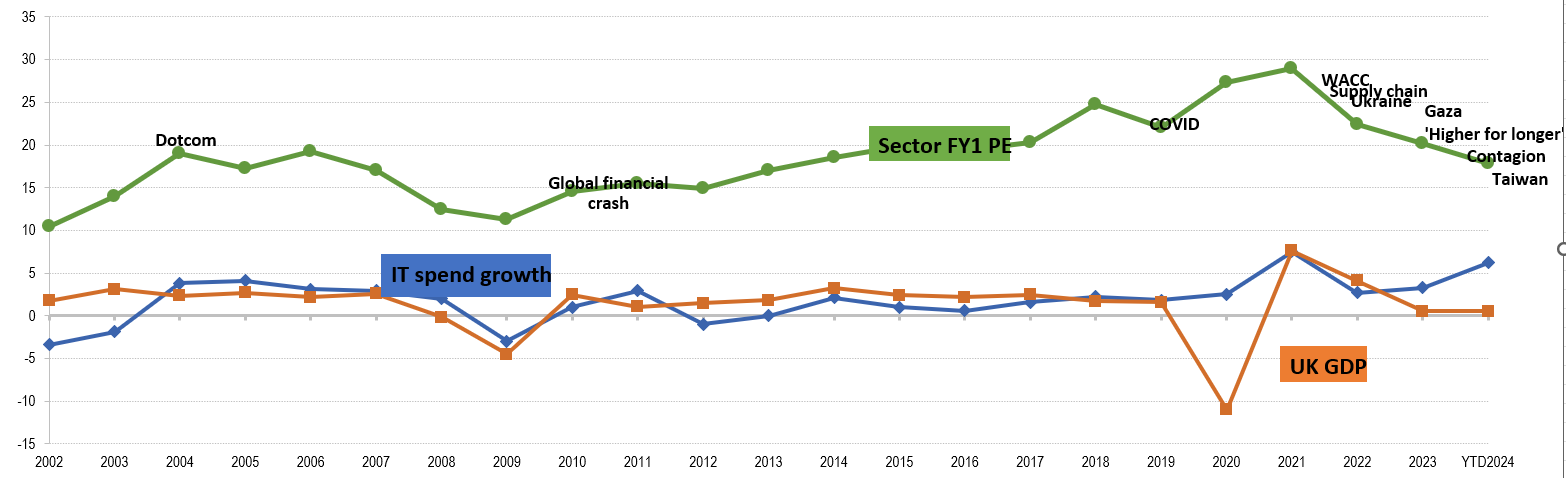
Charting UK GDP growth, IT spend, Sector FY1 P/E
Message in the chart: The upward revision to IT spend estimates by Gartner, was balanced by the subsequent reduction in UK GDP growth and persistent higher cost of capital stymied wider enthusiasm. Note rising IT spend will usually cause a rising PE.
Source: World Bank, IMF, OECD, IDC, Gartner, Yahoo Finance, Technology Investment Services
Enterprise Software ARR, NRR and FCF sequential growth rates (%)
Message in the chart: Salesforce shares were hit hard (-17%, 29 May) on a revenue miss and guidance which trailed consensus. The ensuing panic prompted us to review wider software sector NRR, FCF and ARR to check for any contagion. These are +1.6% (reversing three quarters of decline), +6% and -6.2% sequentially respectively.

Source: Company data, Technology Investment Services
Glassdoor Company ratings
Message in the chart: Somewhat confusingly, given the wage outlook and staff reductions, tech staff are generally happier (3.83x) since January (3.79x). Could it be survivorship bias?
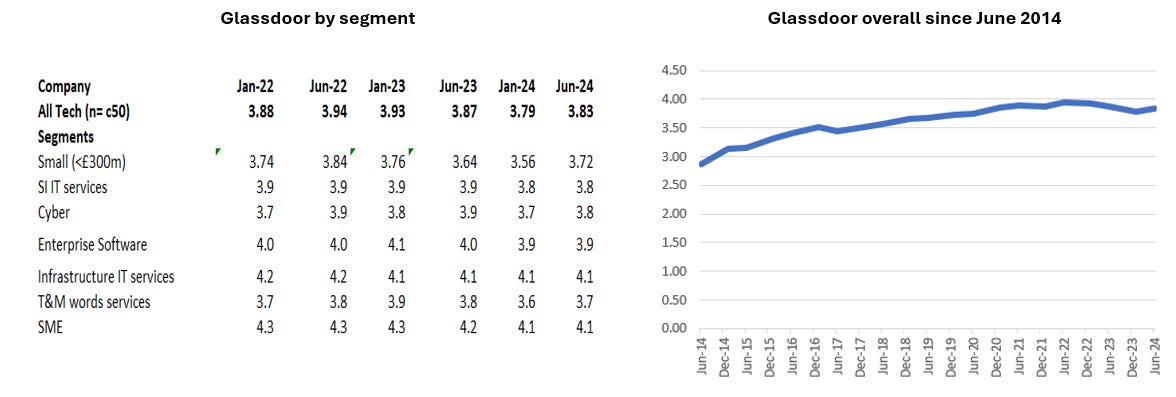
Source: Glassdoor, Technology Investment Services
Valuation heatmap
Message in the chart: The June sector valuation is broadly unchanged since January, however there are interesting changes in the cohorts: notably. Cyber, Data Analytics and Mag 7 remain expensive, cheapest Recruitment (Note SThree today), Data content, and Games. In addition we highlight the opportunity in RAG technologies which are still attractively priced.

Source: Company data, Yahoo Finance, Factset, Technology Investment Services
IPO prices
Message in the chart: Day 1 is important but, as my former boss Tim Linacre would say the share price after a year is the thing. With that in mind we show tech IPO cohorts since 2018, in a ‘where are they now’ exercise.
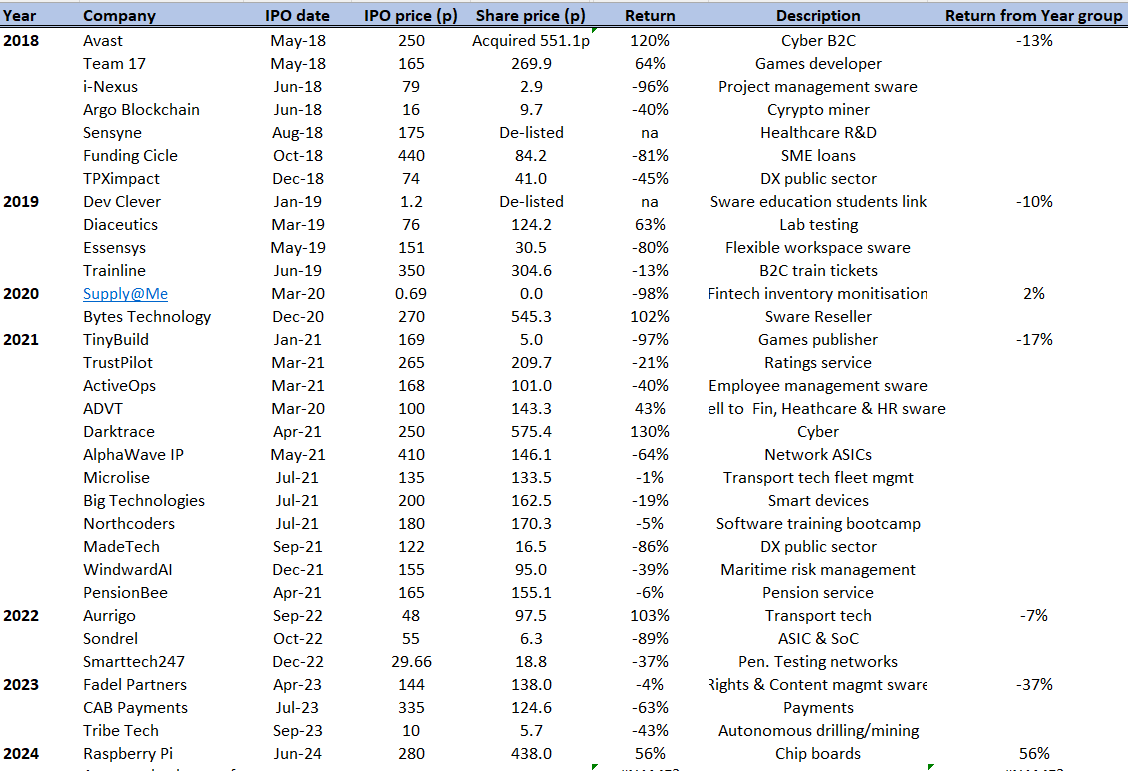
Source: Company data, Yahoo Finance, Technology Investment Services
End notes & Disclaimer: Please read
All information used in the publication of this report has been compiled from publicly available sources that are believed to be reliable, however we do not guarantee the accuracy or completeness of this report and have not sought for this information to be independently verified. This is not investment advice. Opinions contained in this report represent those of the author at the time of publication. Forward-looking information or statements in this report contain information that is based on assumptions, forecasts of future results, estimates of amounts not yet determinable, and therefore involve known and unknown risks, uncertainties and other factors which may cause the actual results, performance or achievements of their subject matter to be materially different from current expectations. The author is not liable for any direct, indirect or consequential losses, loss of profits, damages, costs or expenses incurred or suffered by you arising out or in connection with the access to, use of or reliance on any information contained herein. The information should not be construed in any manner whatsoever as, personalized advice nor construed by any subscriber or prospective subscriber as a solicitation to effect, or attempt to effect, any transaction in a security. Any logo used in this report is the property of the company to which it relates, is used here strictly for informational and identification purposes only and is not used to imply any ownership or license rights between any such company and Technology Investment Services Ltd. Email addresses and any other personally identifiable information collected in the provision of the newsletter are only used to provide and improve the newsletter.
Need more
Let’s chat at Progressive Equity Research here where I am delighted to be a contributing analyst and my website here.
The ask
My name is George O’Connor. I am a tech investment and IT industry analyst. I explore shareholder value, its drivers, the best exponents, the duffers. The target readers are investors, companies, advisors, stakeholders and YOU. If you like this please subscribe and pass it on to colleagues and friends. That said, if you hate it - do the same. Thanks for dropping by dear investor.