


The long and the short of IT
2024 was "very demure, very mindful", does it 'glow' in 2025?


Welcome to 2025. Here we review how the cal2024 roll-up data shapes 2025. The headlines include: (i) Positive TSR: 2024 TSR, +10.7%, reversed a two-year downward trend; (ii) Multiple compression. While there were some bright spots (Mag 7), for the majority valuations just drifted and the average drifted lower in 2024, sector PE ended at 17.5x; (iii) US/UK Valuation jaws widen: as US valuations grow the US/UK jaws remain open; (iv) this ensures that the buyer of UK tech equities are global investors looking to diversify from the strong US prior gains, more bargain hunting PE (i.e. a low M&A premium) and companies themselves (impacting the make-up of TSR). (v) M&A trumps IPOs: Three IPOs vs nine M&A tech exits, but tech-economy 2024 IPO cohort (Raspberry Pi +114%, and Winking Studios +74%) performed well vs the Y/Y compare, 2023 IPO cohort -77%. The 2024 cosplay IPO, Canal+, is -31% on its December debut. The stock of the year 2024 is Made Tech – hat tip Rory and the team. Read on as data insights inform views of the tech-economy.
Cal2024 TSR All Stars: A bounce back year
UK Tech sector 2024 TSR was 10.7% from -5.3% in 2023 and -20.4% in 2022. TSR is comprised of share and dividend movements and of these the gain was the share price appreciation. While 2024 was a banner year for share buybacks (i.e. racking up long-term issues by making illiquid shares more illiquid), this was not the case for ordinary dividends as the strong cash flows were directed to buy-backs.
UK Tech sector TSR since 2009 (%)
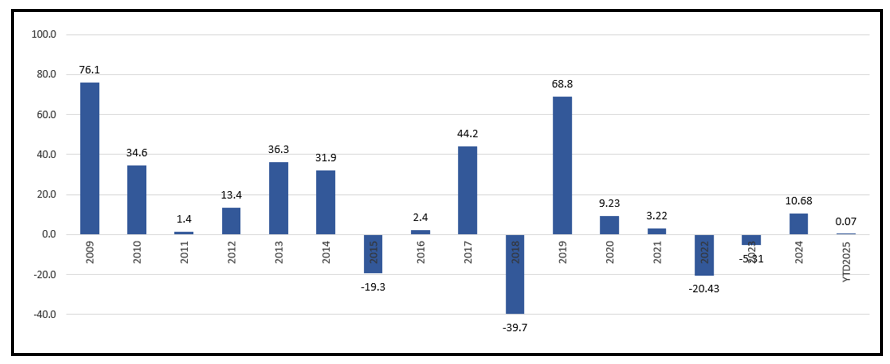
Source: Company data, Yahoo Finance, technology Investment Services
UK TSR by company since 2000 (%)

Source: Company data, Yahoo Finance, technology Investment Services
Looking at UK segments:
While we have been disappointed by the technical progress at our AI-RAG cohort (more agents please) they returned a very positive 24.2% TSR.
Our view that Small (companies) would do better in 2024 came right, the cohort ended the year +8.2%, from -4.2% in 2023.
Investors were better off with IT Services companies where 2024 TSR +25.9%, with Software +0.4%.
Our hopes for tech income shares were largely dashed, TSR 2.1%, as all companies embarked on share buybacks, so more riskier Tech Growth shares were +12.7%.
UK tech segments TSR performance since 2020 (%)

Source: Company data, Yahoo Finance, technology Investment Services
Leading companies of 2024: Made Tech is Stock of the Year
Once again the lesson of LSE is that to make outsized gains, investors must look to the smaller companies. To wit: Made Tech (market Cap £37.3m) enjoyed a superb Recovery year with TSR +197%, which is part of our global IT Professional Services dashboard. It was a A year of Recognition for Eleco (market Cap £122.9m)+184% (and part of our UK select Software dashboard) and A Banner year for Beeks Financial Cloud (market Cap £188.4m) +182%, a constituent of our IaaS cohort. Corero Network Security (market Cap £101m) a new management team moved quickly to strengthen sales execution (particularly in the US) and rewarded shareholders with a TSR +138%. Amongst the larger caps Trustpilot’s (market Cap £1.52bn) new management team made the similar Correct Steps with TSR +121%.
Seeing that bounce back year at Made Tech (the 2024 +197% TSR sits vs TSR -62% in 2023) we are reminded that poorer TSR performers in one year can be stars in the next. The poorer performers in 2024 were: Tribe Technology -99%, Cirata -67.4%, Ocado -59% and Ingenta -58%.

Source: Company data, Technology Investment Services

Source: Company data, Technology Investment Services

Source: Company data, Technology Investment Services
Index Performance in 2024: Go large & Go West
A positive cal2024 for the UK Techmark index saw it +7.4% Y/Y, vs -1.7% in 2023. The UK FTSE Small cap was +7%, from +2.5% in 2023. The FTSE All share +5.6%, vs 3.8% in 2023.
Techmark under-performed the global market, with S&P 500 +24%, Nasdaq 100 +27%. As highlighted by the Russell 1000 (large cap) +23.6%, Russell 2000 (small cap) +10.8% and Bessemer (SaaS) +7.8%, 26% in 2023 tells us that 2024 was a better year for large companies, Mag7 and poor for the once darling SaaS companies. MSCI World Wide Tech was +32.9%, vs 39.4% in 2023.
Index performance 2023 & 2024 (%)
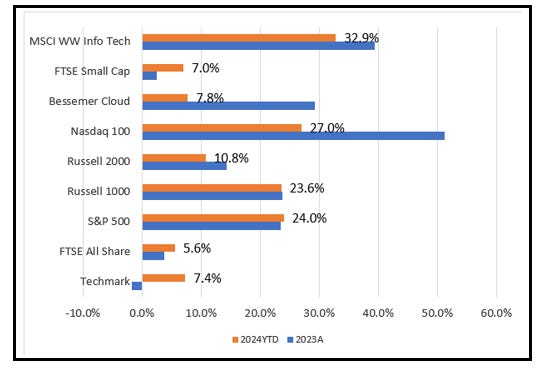
Source: Company data, Yahoo Finance, technology Investment Services
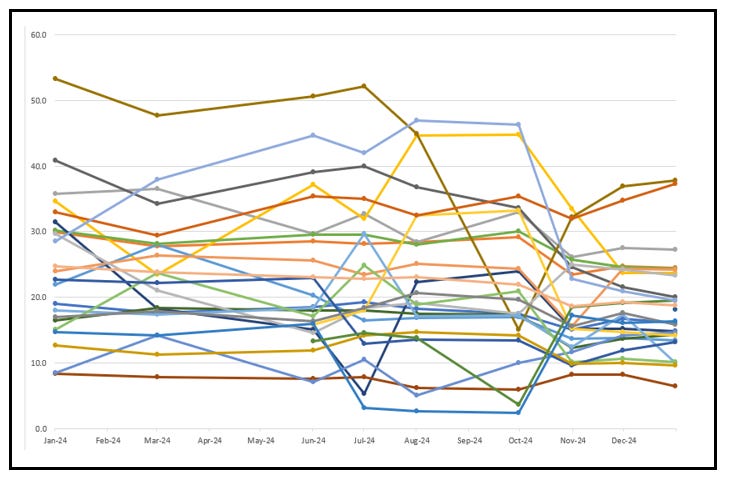
Intra-year 2024 Techmark 100 index: No Santa rally
The Techmark index gave up the earlier gains in late Q3 and through Q4 as H2 company outlook statements telegraphed an uncertain demand environment for 2025. Functionally, the impact of GenAI technologies remains a core demand-side driver, with companies stealing budget from other areas. Also PoCs are taking longer than expected to turn to scale-up implementation, leading to some disappointment at a slower than expected transition to the ‘new’.
Techmark Index: Intra-year view

Source: Yahoo Finance, Technology Investment Services
That said GenAI revenue growth was very strong thru the GenAI natives.
Reported revenue by GenAI natives

Source: Sapphire Ventures
Sector valuation
The UK tech sector ended on a 17.5x PE, from a 19.0x PE in January 2024. The long-term average (since 2000) is 17.4x.
UK Tech FY1 P/E since 2000 (x)

Source: Company data, Yahoo Finance, Technology Investment Services
The Valuation heatmap: Compression of multiples
The chart below shows how EBITDA multiples across the tech universe compressed through cal2024.
Tech Universe EBITDA multiple compressed in 2024
Source: Company data, Yahoo Finance, Technology Investment Services
Favoured, and out-of favour, tech cohorts
Current mostly ‘red’ tech cohorts: The expensive shares are Mag7, US SaaS, AI, Accounting/Financial, US long list.
Current mostly ‘green’ tech cohorts:The cheap shares are Recruitment, IT Infrastructure Services, Content Tools and IoT.
Tech Sector Valuation heatmap (x)

Source: Company data, Yahoo Finance, Technology Investment Services
The UK tech long list: Valuation overview

Source: Company data, Yahoo Finance, Technology Investment Services
Points to ponder
SaaS – Down/Up/Down
SaaS had a difficult 2024, initially impacted by concerns of a soft spending environment and that the many GenAI PoCs were being funded from the (i.e. easy to spin-up/easy to spin down) SaaS budgets. Q2 the companies (think Salesforce, Adobe but the move was widespread) develop and sell ‘AI’ modules which led to a recovery. However, from H2, the notion of agenticAI gathered momentum and so depressed investor sentiment. The idea is that companies use AI agents to develop their own enterprise applications; for the majority of use cases this is ‘wishful thinking’ but it led to a more widespread valuation pull-back in the SaaS community. Our view is that the majority of use cases are based on the ‘co-pilot’/ efficiency, either making workers more productive, or replacing them for certain use cases. AgenticAI requires a degree of technology experience not common to all.
Buyers Reasons to deploy GenAI

Source: Bessemer
It’s the economy, stupid
While AI is a generational theme in the tech industry, once again the key investor concerns were the ongoing macro and geo-political backdrop. The 2024 year was characterised by central banks successfully reducing inflation, and whilst this initially had the positive effect of reducing the 10-year rate (we use UK 10 year gilt yield in our WACC and DCF assumptions), this was short lived. The rate increased in Q4 in the wake of the UK Budget. Sector valuation tends to move in the opposite direction of the ten-year, so a rising rate means lower valuation. Hence the rather dull end to 2024, despite some earlier optimism and a negative harbinger.
Opposites attract: UK Gilts and Valuation

Source: FT.com, Technology Investment Services
The sector shrinks as M&A out-numbers IPOs
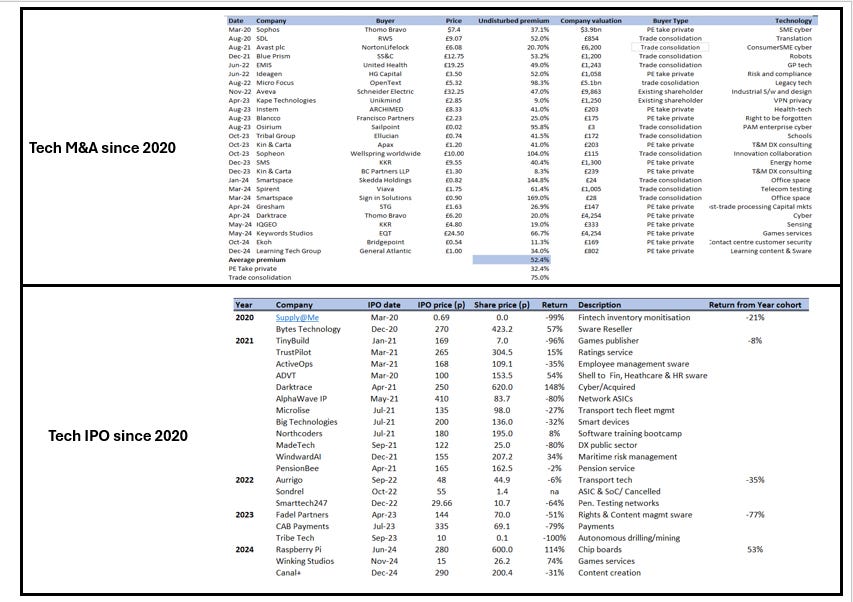
Source: Company data, Yahoo Finance, Technology Investment Services
End notes & Disclaimer: Please read
All information used in the publication of this report has been compiled from publicly available sources that are believed to be reliable, however we do not guarantee the accuracy or completeness of this report and have not sought for this information to be independently verified. This is not investment advice. Opinions contained in this report represent those of the author at the time of publication. Forward-looking information or statements in this report contain information that is based on assumptions, forecasts of future results, estimates of amounts not yet determinable, and therefore involve known and unknown risks, uncertainties and other factors which may cause the actual results, performance or achievements of their subject matter to be materially different from current expectations. The author is not liable for any direct, indirect or consequential losses, loss of profits, damages, costs or expenses incurred or suffered by you arising out or in connection with the access to, use of or reliance on any information contained herein. The information should not be construed in any manner whatsoever as, personalized advice nor construed by any subscriber or prospective subscriber as a solicitation to effect, or attempt to effect, any transaction in a security. Any logo used in this report is the property of the company to which it relates, is used here strictly for informational and identification purposes only and is not used to imply any ownership or license rights between any such company and Technology Investment Services Ltd. Email addresses and any other personally identifiable information collected in the provision of the newsletter are only used to provide and improve the newsletter.
Need more
Let’s chat at Progressive Equity Research where I am delighted to be a contributing analyst and my website.
The ask
My name is George O’Connor. I am a tech investment and IT industry analyst. I explore shareholder value, its drivers, the best exponents, the duffers. The target readers are investors, companies, advisors, stakeholders and YOU. If you like this please subscribe and pass it on to colleagues and friends. That said, if you hate it - do the same. Thanks for dropping by dear investor.