


The long and the short of IT
Into the UK Election: Man the Compass


With UK LSE reporting season ebbing, we look westward, eastward and to all compass points to ascertain the health of our companies and end markets. That said, the main news is the UK Election timing (now a fixed way point) which was greeted positively by the investment community. To wit: Tech sector TSR (+11.4% YTD) and Techmark index (+12.4% YTD) both navigating better. What happens in purdah and wash-up is of secondary importance as we think more about events after the election and the approach of the new administration. At this juncture we do not get an impression that an incoming Labour government will have a radical style similar to the Conservative/Liberal government of 2010 (the last time we had a regime change following a long-standing government). That administration created the ERG (Efficiency Reform Group, reporting to the Cabinet office) which forced new T&Cs on core government suppliers. This does not feel realistic and for now investors in the strategic suppliers can breathe easily, but we have a long run to the 4th July. The news of the election has been a net positive swabbing away the uncertainty, and while there will be some contract hiatus this is expected, and to some extent ‘priced in’. Indeed, shares in companies like Bytes (62% of GII is Public Sector, where there will be little interest in buying the latest Microsoft software upgrade in the short term) did not weaken on the news. From results we look at Nvidia, Endava, Xero and Workday to read the sector tea leaves. In brief:
Nvidia Q1 results (22 May) remind us of our folly in encouraging investors to look wider at GenAI adoption. Q1 results featured a blistering set of KPIs (see our Nvidia dashboard - below) although investors might as well just dwell on the Rule of 40 result – and think ‘golly’. The forthcoming Ten-for-one stock split (effective 7 June) is likely to rally the shares further, despite the theory. We remembered our IaaS viewpoint as we read Jensen Huang, Founder & CEO state: “companies and countries are partnering with NVIDIA to shift the trillion-dollar traditional data centers to accelerated computing and build a new type of data center — AI factories — to produce a new commodity: artificial intelligence”. Despite Nvidia continuing to deliver superb KPIs we still see a wider opportunity in GenAI and in the GenAI (other) bricks and mortar companies, but for now Nvidia seems untouchable despite industry moves to compete.
Endava Q3 results (23 May) reported in line but the mix of KPIs veered more negative than positive with a sharply deteriorating revenue. Of note: Q3 revenue, £174.4m, down 14.3%, -11.8% c/c Y/Y, with Loss before tax £0.5m reversing the PBT £30.4m Y/Y, Adj PBT £15.5m, vs £43.4m Y/Y. Endava is UK headquartered but is an offshore & near shore supplier (c45% of FTEs). The Q3 numbers were in line with the operating deterioration, but we take some encouragement from CEO John Cotterall saying that “the overall demand environment remains challenging but stable and we are seeing signs of increasing discretionary spending. Client behaviour is stabilising but sales cycles remain elongated”. We show the Endava report card, our undated IT Professional Services cohort dashboard and (oh, why not) our revenue/head/geography model (see below).
We have yet to hear from UK Public Sector IT Professional Service companies, chiefly Made Tech and TPXimpact, but we expect messages of; (i) welcome the election timing, (ii) continuing to work through multi-year contracts, (iii) new contracts will have a natural ‘pause’ but the business of government continues as does the wider ‘modernisation’ agenda etc. Shares to recover on the calming news.
Workday Q1 results (23 May) saw shares sink -12% afterhours in the now familiar mix of numbers in line/guidance disappointment. That said, this cohort remains one of the most expensive of those monitored. Of Note:
Workday entered the US security market for the first time. Hopefully this becomes a door-opener for both the wider 5i’s community and to get Kainos pulled along in its wake.
The recovery in profit, led the recovery in cash with operating cash US$372m, vs US$277m Y/Y and Free cash US$291m, vs US$218m Y/Y.
Gross revenue retention remains stuck at 95% - we struggle to understand why it is stays so low.
Xero finals (22 May) similarly came with some disappointment. FY revenue NZ$1,713.77m, NZ$1,399.88m Y/Y with Net income, NZ$174.64m, vs a net loss NZ$113.53m Y/Y. The KPIs remain very impressive (see below), but there is some drift and in truth some semblance of mean revision. That said we would like Sage to think about Xero’s excellent transparency.
The data
Nvidia: Selected KPIs - hello hockey stick

Source: Company data, Analyst (George O’Connor)
IT Professional Services dashboard

Source: Company data, Analyst (George O’Connor)
Endava: Latest report card

Source: Company data, Analyst (George O’Connor)
IT Professional Services Revenue/FTE/region (US$’000)
Note: Exchange rates as 23 May. Source: Company data, Analyst (George O’Connor)
Financial Apps companies - FY1 P/E over time (x)

Source: Company data, Factset, Yahoo Finance, Analyst (George O’Connor)
Xero: KPIs over time (x)

Source: Company data, Analyst (George O’Connor)
Updated Valuation heatmap
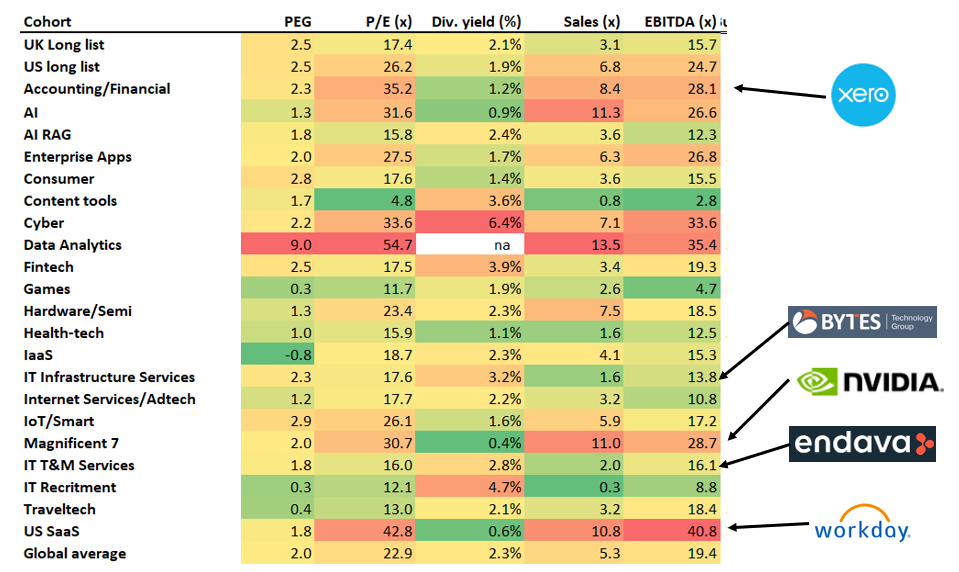
Note: priced 24 May. Source: Company data, Factset, Yahoo Finance, Analyst (George O’Connor)
End notes & Disclaimer: Please read
All information used in the publication of this report has been compiled from publicly available sources that are believed to be reliable, however we do not guarantee the accuracy or completeness of this report and have not sought for this information to be independently verified. This is not investment advice. Opinions contained in this report represent those of the author at the time of publication. Forward-looking information or statements in this report contain information that is based on assumptions, forecasts of future results, estimates of amounts not yet determinable, and therefore involve known and unknown risks, uncertainties and other factors which may cause the actual results, performance or achievements of their subject matter to be materially different from current expectations. The author is not liable for any direct, indirect or consequential losses, loss of profits, damages, costs or expenses incurred or suffered by you arising out or in connection with the access to, use of or reliance on any information contained herein. The information should not be construed in any manner whatsoever as, personalized advice nor construed by any subscriber or prospective subscriber as a solicitation to effect, or attempt to effect, any transaction in a security. Any logo used in this report is the property of the company to which it relates, is used here strictly for informational and identification purposes only and is not used to imply any ownership or license rights between any such company and Technology Investment Services Ltd. Email addresses and any other personally identifiable information collected in the provision of the newsletter are only used to provide and improve the newsletter.
Need more
Let’s chat at Progressive Equity Research here where I am delighted to be a contributing analyst and my website here.
The ask
My name is George O’Connor. I am a tech investment and IT industry analyst. I explore shareholder value, its drivers, the best exponents, the duffers. The target readers are investors, companies, advisors, stakeholders and YOU. If you like this please subscribe and pass it on to colleagues and friends. That said, if you hate it - do the same. Thanks for dropping by dear investor.