

The long and the short of IT
GenAI productivity: “They seek it here, they seek it there”


Q2 reporting started with a flourish. Week 1 was ‘in line’ but performance was patchy. The results remind us to look for the GenAI Productivity gains which is a Scarlett Pimpernel - where is it? ‘Elusiveness’ risks undermining some of the fruity valuations in the tech sector - worry not, dear investor, we have found it. In this edition we also explore the pointlessness of cloud migration as we mull over the lessons from SAP’s Q2 print, and show how Microsoft’s attempts to guillotine the reseller industry have been partly muffled. We look optimistically to Week 2 and are encouraged by the renowned investment manager, Katie Potts at Herald Investment Trust who opines: “In an unsettled world with excessive Government deficits and growing geopolitical tensions, returns are going to be more difficult to achieve from a wide range of financial and other investment assets. Nevertheless, the pace of innovation is faster than ever, and we continue to be excited to be globally diversified in the growth sectors of technology and communications” - that damned elusive pimpernel!
Tech Universe results and updates this week span AI-RAG (MONY, Relx); Data & Analytics (SAP, ServiceNow, Pegasystems); IT Infrastructure Services (Atea, Econocom); IT Professional Services (Coforge, Infosys, Mastek, Tietoevry, IBM, SopraSteria, Hexaware); UK Software (Aptitude, Eleco, GB Group, Netcall); IaaS (Digital Realty, Google, Iomart), Managed Services (SysGroup); Recruitment (Robert Half); IoT/Smart (Mobileye); Travel-Tech (Travelzoo). Read on. Data insights (not navel gazing) inform our evolving views on the tech-economy.
The tech drivers and Points to Ponder
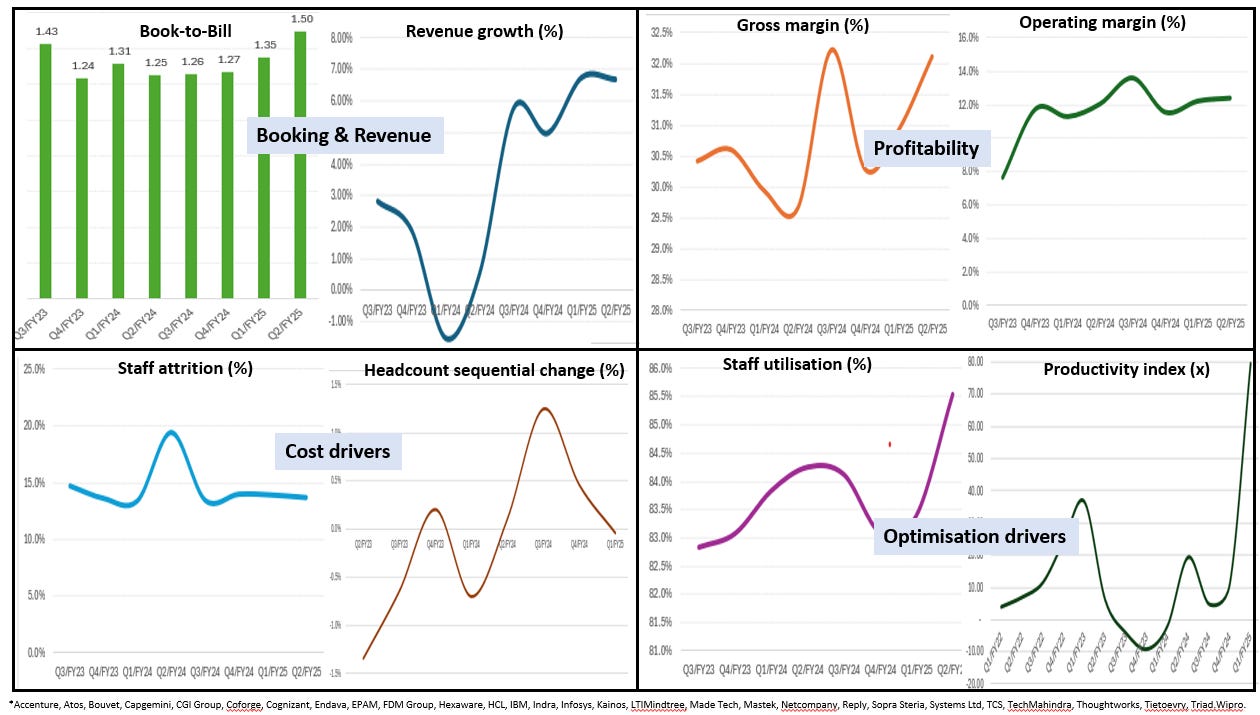
1. Professional Services: Any sign of the Great Productivity gain?
The GenAI productivity gain is subject to growing doubts.
Macro-economic models suggest GenAI could increase annual labor productivity growth by 0.1% to 0.6% through 2040 with the results dependent on adoption pace and industry application. GenAI productivity improvements have been quantified across multiple studies (10%–35% for direct users on measurable tasks) but the results are variable: Workers save 5.4% of their total work hours/week; in a Customer support environment there is a 14% average increase in agent productivity; knowledge workers (programming and analytics) finish tasks 10% faster; Software developers productivity increases range from 20% to 55% for specific coding tasks. But productivity improvement varies widely by occupation, task type, and user experience. The highest gains are documented for routine, information-processing, or text-based work, while complex judgment tasks see smaller or no gains.
ServiceNow CEO Bill McDermott (AI deals +50% sequentially in Q2) said the “AI revolution is in full flight and knows no boundaries" and the “soul crushing work is increasingly being done by agenticAI”. Coforge CEO Sudhir Singh opined “we’re not seeing 70–80% productivity spikes like some claim. We’re seeing something closer to 30%, depending on the function”. The IT Professional Services industry seems to have adopted Pega’s Blueprint software as a standard (see below) and there, CEO Alan Trefler says that the “gains we look for aren’t just internal efficiency; they show up in pricing power and revenue productivity.”
Now that 2.6m out of our 3.6m FTE company IT Professional Services cohort have reported Q2 we assess the data to see if the industry is ‘eating its own dog food’ and is gaining from GenAI.
From the data (below) we see revenue growth ticking upwards (YTD Q2 revenue growth is 6.68%, from 6.74% Q1, and 0.5% in Q2/24). There is a similar progression in EBIT margin with YTD Q2 being 12.4%, from 12.2% in Q1, and 12.1% in Q2/24. Not illustrated but both ROE and FCF margin (10.5% and 8.8% respectively) also echo that improving Y/Y trend (9% and 5.1%).
The GenAI surge is in the productivity numbers. Our Productivity Index measures the change in revenue for a unit change in headcount. Historically, for the IT Professional Services sector these two are inextricably linked. Simply put, to deliver more revenue companies need to hire more bodies. In Q1 there was a marked step change - revenue grew with flat headcount. Clearly utilization improved (83.4%, from 83l.1%) but that was not dramatic. It is too early to see if the pattern repeats in Q2 but if investors want to see a GenAI productivity leap ‘in the numbers’ it is here.
We are in the early days of this (secular) phenomenon, and it may tack in different directions depending on training, spend decisions etc, but it is a significant boost to the IT Professional Services industry. These are also way ahead of any:
change in T&M pricing models to outcomes and,
mass adoption of agenticAI.
Productivity - The Great Surge
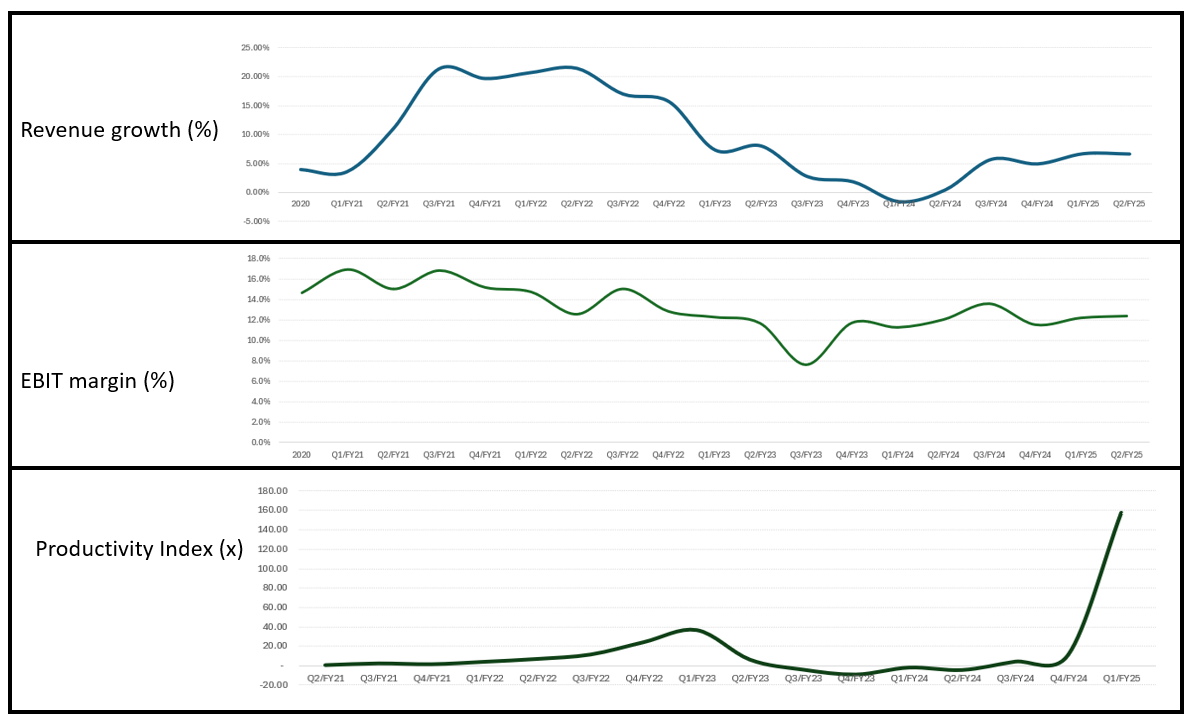
Source: Company data, Technology Investment Services
2. A ‘sap in the face’ for cloud migration, does it matter anymore?
Two standout points from this weeks SAP Q2 results (see below):
At results SAP trumpeted the Q2 cloud revenue, +24% Y/Y, far out-growing Group revenue, +9% Y/Y.
Christian Klein, CEO commented that “Enterprise operations are about to enter a new era” and SAP expects the total number of available AI agents to reach 40”.
All tech companies have gone though/are going through an on-prem to cloud migration (see below). Yet this process relates to the last technology cycle. Today, GenAI is being deployed across on-prem and cloud environments. Cloud deployment is preferred when the customer is concerned with scalability, payments (i.e. capex vs Pay-as-you-go) and access to cloud models. For on-prem the driving issues tend to relate to data control, sovereignty, security and customisation. In highly regulated industries data sovereignty and compliance are non-negotiable so there will be an on-prem bias.
In our view, the current KPI emphasis on cloud migration, like at SAP and many others (see below), should begin to shift to AI-based KPIs. Yet, with only 40 AI Agents (12/25) at SAP, we appreciate that this will take time – although the gap will give others an opportunity to ‘break out’. Looking at valuation (below) the group trades in a narrow range with little to reflect a better or weaker GenAI footprint, but as the GenAI era gathers, and investors think more about AI deployment rather than AI supply chains, valuations will change. New expected entrants such as Visma have an opportunity to steal the march, or at least not get lassoed as an(other) on-prem to cloud investment play.
SAP’s cloud journey
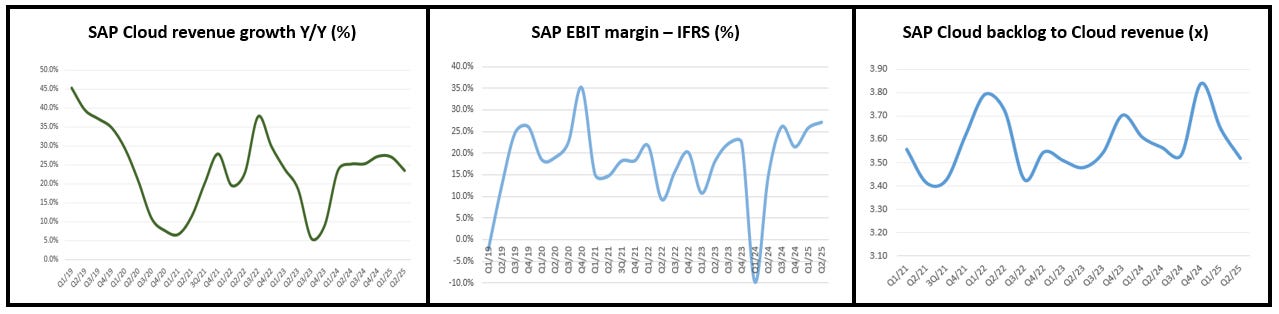
Source: Company data, Yahoo Finance, Technology Investment Services
Beyond SAP: Cloud as percent of Group revenue and valuation over time
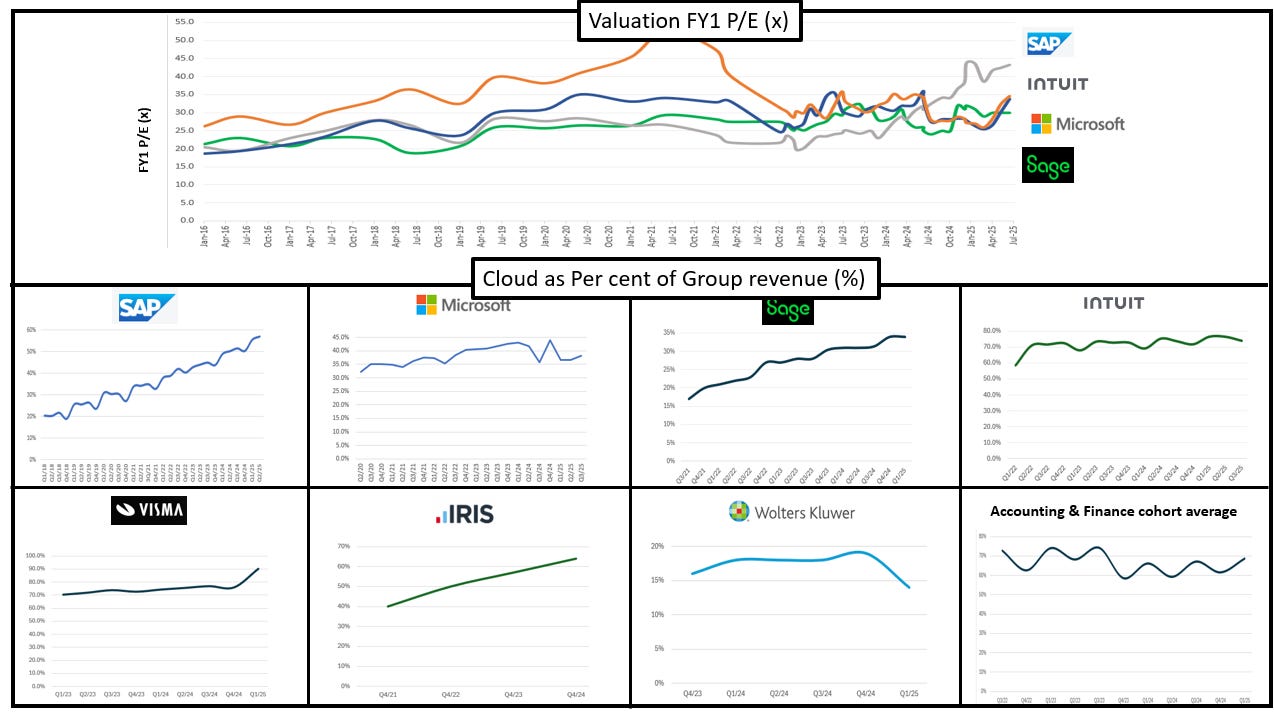
Source: Company data, Yahoo Finance, Technology Investment Services
3. Microsoft EA change is affecting resellers & It’s only just begun
The talking point around Microsoft changes to its Enterprise Agreement (EA) reseller programme is starting to feed into the numbers (Bytes, Atea) and will continue to impact profit and cash through Q2. This will take time to neutralize as resellers will need to build a wider service offer. That said, there is a spoiler for Q2/3 as hardware sales will rise due to the Windows 10 migrations. Atea raised a note of deeper caution saying that following Microsoft “most, if not all, software vendors have or will change their approach”. Here is a quick EA refresher:
Microsoft introduced significant changes to its EA reseller programme and licensing structure in 2025 where it is trying to push (not nudge) cloud subscription models and a more customer-centric, partner-driven strategy. This sees:
EA Renewal Changes: Starting January 1, 2025, certain cloud Enterprise Agreements in direct markets will no longer be eligible for renewal under the existing EA framework. Affected customers will be notified and guided to transition either to the Microsoft Customer Agreement for Enterprise (MCA-E) – this is larger 3000+ employees - or to the Cloud Solution Provider (CSP) programme - SME customers (500+ employees).
This removes some traditional reseller support and incentives on licensing commissions. Resellers are encouraged to provide value-added services and managed support, cloud migrations, security, and AI-focused solutions.
To encourage the transition, Microsoft is offering a 15% discount on Microsoft 365 E5 annual commitment subscriptions for eligible customers, available through June 2025 – so there may be a bundling of the ill-effect for Q2.
The MCA-E comes with a new billing structure: instead of a single invoice, organisations will manage multiple billing profiles and invoice sections.
The Maximum Resale Price (MRP) calculation formula for channel partners will be updated in July 2025 across all Microsoft products, impacting partner pricing strategy.
Microsoft is increasing licensing costs for some products (e.g. Teams Phone, Power BI) from April 2025. New monthly billing plans for annual subscriptions (e.g.365 Copilot) will carry a 5% premium over upfront annual billing starting December 2024, with broader standardisation of monthly pricing across all channels in April 2025.
In July 2025, Microsoft implements a significant change to the Maximum Resale Price (MRP) calculation formula for all channel partners, impacting all products under volume licensing agreements. This update is designed to standardise channel pricing, promote consistency across programs, and ensure greater transparency for channel partners and customers. The update applies to all Microsoft products transacted via channel partners, including traditional volume licensing, the CSP program and other channel agreements. It is especially relevant for those serving public sector customers, where maximum resale prices are often scrutinized for compliance.
The valuation impact is starting to feed through & no easy recovery
Source: Company data, Yahoo Finance, Technology Investment Services
Latest company news, financials & Updates
AI-RAG
MONY/Moneysupermarket.com. Investment in data and tech platform is providing a scalable and competitive springboard to “unlocking our AI and new product development opportunities” - just the sentiments we are looking for at this juncture of the AI-RAG evolution. H1 revenue +1% Y/Y, Adj EBITDA +2% Y/Y, Operating costs -6% Y/Y. Helped customers to save an estimated £1.4bn, the SuperSaveClub surpassed the 1.5m members (+0.5m since February) and it generates 14% of Group revenue. MONY is shifting from a transactional to member-based business models In comparison with a baseline traditional MoneySuperMarket users, SuperSaveClub members:
40% more customers coming directly for their second purchase.
Members have a 3x increase in renewals, and a 3x increase in second purchases.
Members have a 2x increase in their propensity to interact with CRM and a 4x increase in the take up of the MoneySavingExpert App (the UK's leading consumer finance platform - 2.2m downloads, >0.5m MAU).
In time this will lower reliance on paid advertising for customer acquisition. In addition, by providing compelling reasons for members to come to us directly, transaction volumes should increase leading to higher revenue/customer and lower cost of sales. Peter Duffy, CEO: “The investment we've made to date in our data and tech platform means we have a scalable and competitive springboard to unlock further AI and innovative product development opportunities.”
The numbers we track: MONY
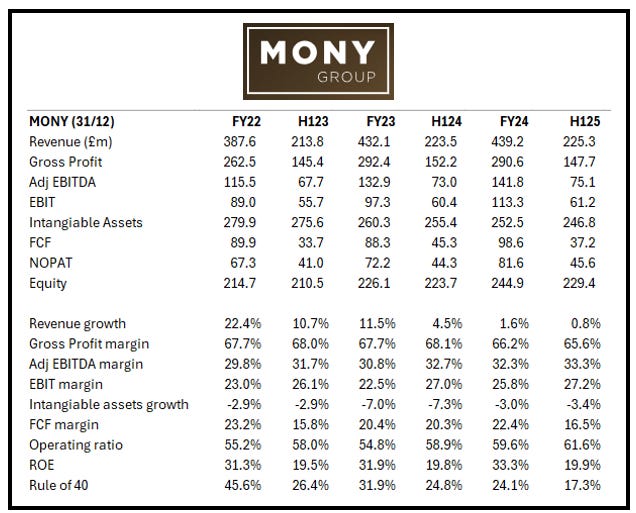
Source: Company data, Technology Investment Services
Relx. Strategic messages from the H1/25 print are ‘on the button’. CEO Erik Engstrom commented that the improving long-term growth trajectory is due to the ongoing shift to higher growth analytics and decision tools. Relx develops these tools by “leveraging deep customer understanding to combine leading content and data sets with powerful artificial intelligence and other technologies”. 7% Y/Y revenue growth with all four business areas contributing with Risk continued to deliver “strong growth”, Scientific, Technical & Medical delivered “good growth”, Legal growth “continued to improve” and Exhibitions delivered “strong growth”. We noted the Legal division where Lexis+ AI (integrated GenAI platform) continued its growth trajectory in the US and international markets joined by the debut of Protégé (GenAI legal assistant) launched in Lexis+ AI in the US this year is “progressing well” and is extended across products and geographies. Capital expenditure was £255m (2024: £233m) which included £243m (2024: £225m) in respect of capitalised development costs, reflecting sustained investment in new products.
The numbers we track: Relx
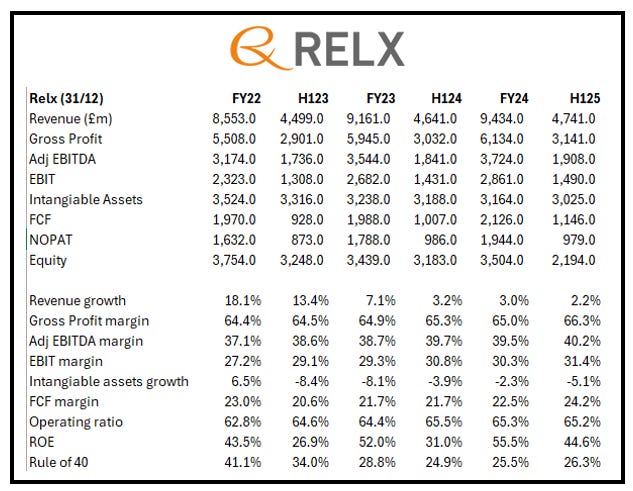
Source: Company data, Technology Investment Services
Data & Analytics
SAP. SAP Q2 cloud revenue +24% Y/Y as Group revenue +9% Y/Y but Q2 missed revenue estimates beat earning (the full year effect of the 2024 downsizing programme). Q2 cloud revenue performance was “particularly strong” in APJ and EMEA and “solid” in the Americas region with an “outstanding performance” in Brazil, Chile, France, India, Italy, South Korea and Spain and particularly strong in Canada, China, Germany, Japan, and the US. Christian Klein, CEO: “Enterprise operations are about to enter a new era, and SAP is best positioned to benefit from that evolution” while CEO Dominik Asam added that “we remain cautiously optimistic, keeping a close eye on geopolitical developments and public sector trends” (an oblique reference to prolonged sales cycles in US public sector). Note from the conference call: "By the end of the year, we expect the total number of available AI agents to reach 40. The agents will work across business functions."
Pegasystems. Pega develops Enterprise low code software (‘Pega Blueprint’ users describe their business in plain language and Blueprint uses generated AI agents to transform and use) posted a beat with revenue, US$384.51m, +9.5% Y/Y and EPS, US$0.28,US$0.26 Y/Y vs consensus revenue US$368.77m and consensus EPS US$0.24. Net new ACV add +60% Y/Y. Flagged potential seasonal softness in Q3 2025 and there was some profit taking on the print. From the call:
Competitors are creating prompt studios and suggesting that clients are trying to manage these agents with free text prompts that will be interpreted differently every time they run. We think that’s a little mad.
At their keynote at PegaWorld, Vodafone spoke about how they’re using Blueprint to start every new development project and is able to take their budget process from ideation to a delivered production app in under forty hours.
In the forty days or so since we announced this concept (Blueprint), we’ve had many of the world’s largest systems integrators sign up to develop their own branded blueprints to use directly with their clients, including Accenture, Capgemini, Cognizant, Infosys, TCS, and Virtusa with, more in the works. Blueprint gives them a powerful tool that they can use to collaborate and ideate with their clients around their IP.
The numbers we track: Pegasystems, SAP, Servicenow
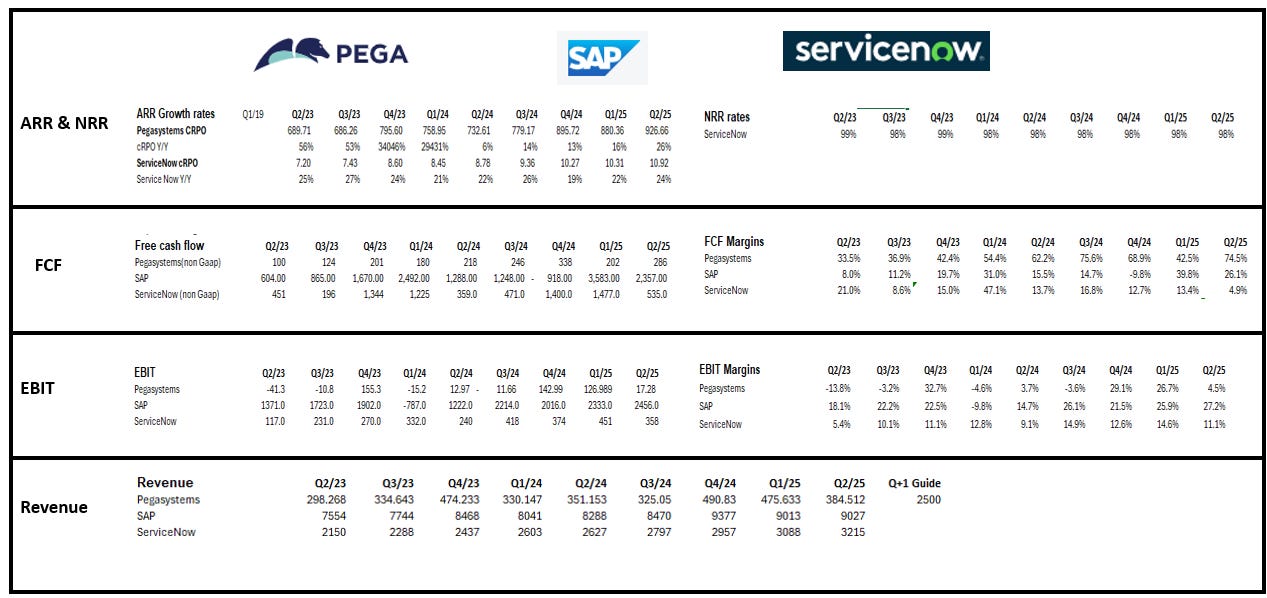
Source: Company data, Technology Investment Services
IT Infrastructure Services
Cohort Scenario: This sector has been cautiously emerging from a cyclical downturn following demand volatility in the years following the end of the COVID pandemic. Since H2/24, demand for hardware has picked up across product categories, Day Sales are recovering, but margins (gross and operating) remain under pressure. Positively the cohort is doing more higher margin services revenue, although it will suffer from the utilisation issues common to the IT Professional Services cohort. There are multiple demand-side drivers for this cohort. The most immediate one is Windows 10 end-of-life, and IT security continuing as a top investment priority for organizations as threats of cyberattacks and data breaches continue to grow and from a regulation the EU Network and Information Systems 2 (NIS 2) Directive (a baseline of cybersecurity requirements for the public and private sector) was adopted into local law by EU countries in 2024. However, soundings from the latest batch of analyst conference calls suggests that this effect could drift into 2026. Generally, the cohort KPIs are emerging from a cyclical downturn. As a caution we note that as spend returns, there will be pressure on inventory days which in turn will soak up working capital – and a feature of the latest results is that inventors are increasing. The warning from Bytes serves to remind us that notwithstanding a fragile macro and changes in EA that company actions determine outcomes.
IT Infrastructure Services: KPI Dashboard
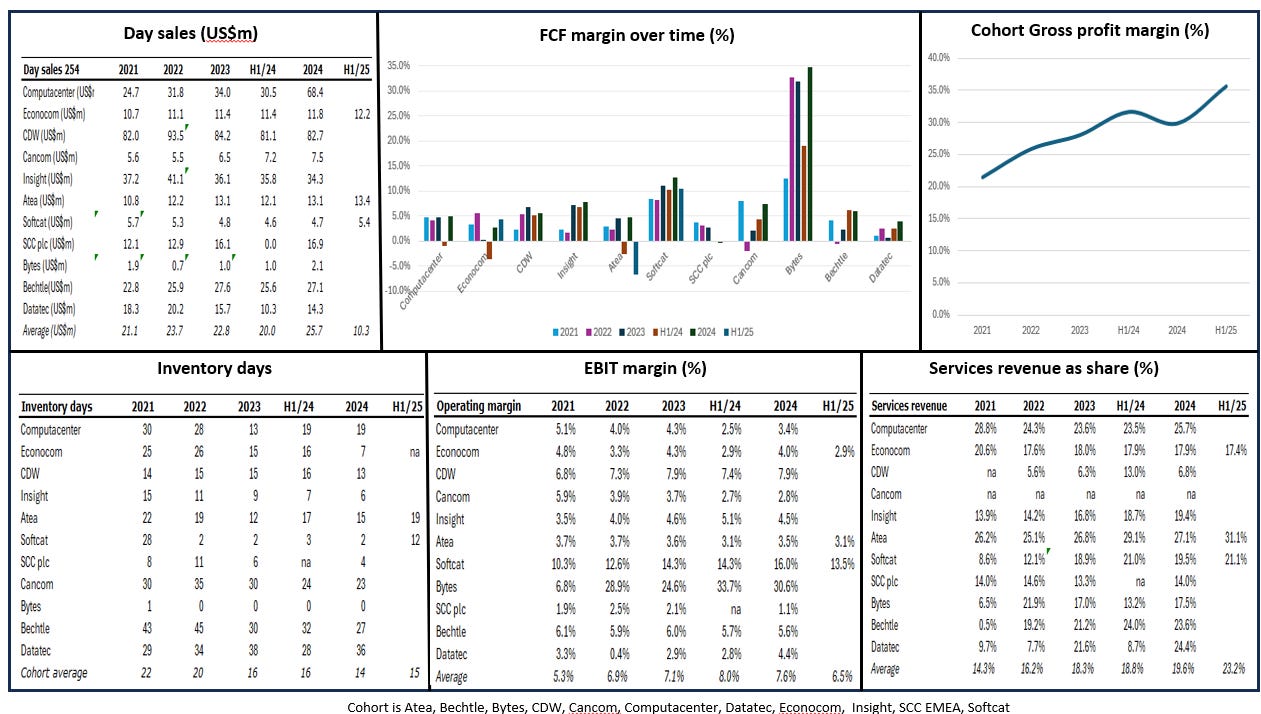
Source: Company data, Technology Investment Services
Atea. H1 gross sales +15.3% Y/Y to NOK30.0bn with organic sales growth 11.7% Y/Y. In the mix hardware +13.4%Y/Y with “higher demand across all major categories”, Software +20.3% due to increased sales to public sector (c. 70% of Atea’s sales are public sector) and Services gross sales +8.8% Y/Y with high growth in consulting and product support. There was a NOK111m operating cash outflow (usually a moderate cash inflow) explained as elevated working capital due to a “higher-than-normal level of school PC inventory which was purchased in the second quarter but scheduled for delivery and collection in the third quarter”. Note: Microsoft co-pilot 38,000 licenses in Q2, up from 21,000 in Q1. Guides for FY sales growth of c.10% and EBIT growth of 10-20% due to:
Robust H2 demand, but reported growth in product sales will slow due to more challenging comparable periods in 2H 2024.
EBIT growth will remain solid in Sweden, Norway and the Baltics, as seen in Q2.
EBIT in Denmark and Finland will show a turnaround from weaker results in H2/24. “The extent of the turnaround is the primary sensitivity in the guidance range”.
Econocom. H1 revenue, €1,421m, +6.6% Y/Y, 5.9% organic (four “tactical transactions” in Germany, Spain, Ireland and the UK) with the Technology Management & Financing division leading the growth. The 2.9% operating margin (flat Y/Y) after sales investments and “competitive pressure in Products & Solutions”. CEO Angel Benguigui commented that the company is No.1 AV integrator in Europe following the acquisitions and the company remains focused on “transforming our Group, enabling us to scale synergies and accelerate on value creation across all our business lines and geographies” – for us the best response to the pressure from Microsoft EA. From the divisions we noted that Products & Solutions revenue, €575m was -2.4% Y/Y in a challenging market with a €5.8m EBIT unchanged but followed “competitive pressure in particular at renewal of contracts and lower operational leverage”. Also Services revenue, €248m grew +3.6% Y/Y.
IT Professional Services
Cohort scenario. The cohort has c.3.6m FTEs, and to date (25/7) companies responsible for 2.6m have reported. Contrarily, given the weak economic backdrop, coupled with an expected change to rev/rec we see grounds for optimism. The Q1 KPIs suggested that the recovery is slowly on track with revenue, margin and FTE growth and the trend continued in Q2 (Q2 revenue growth 6.68%, vs 6.74% in Q1 and 0.5% Q2 last year ). Generally, bookings have recovered (this is happening globally) and FY revenue growth c3-5% looks achievable (current guidance mid point is 3.6%) as the cohort slowly emerges from the aftermath of the Covid and immediate post-Covid environment which saw the industry over-hire. Since then, staff attrition dried up impacting profitability. The industry has limited pricing power (i.e. inflation clauses). In addition, (i) GenAI has given the industry a new secular growth driver and a new twist to Digital Transformation programs, and (ii) the sector will benefit from increasing Defence spend. From the KPI dashboard the industry is slowly starting to rehire and re-train existing staff which in the short-term dents utilisation. Shares in the cohort are cheap reflecting the past two difficult years, difficult macro and the uncertain impact of GenAI technologies on headcount businesses. However the dashboard is starting to telegraph an operational recovery noted by the Y/Y improvement in ROE (currently 10.5%).
IT Professional Services: KPI Dashboard
Source: Company data, Technology Investment Services
Infosys. The second largest Indian-based company trumped its larger rival (TCS) by reporting Q1 revenue +3.8% Y/Y to US$4,941m, 20.8% operating margin, both ahead of consensus, and FCF US$884m. Recap: At TCS revenue shrank in the same period. The total contract value (TCV) of large deal wins was US$3.8bn with a net new of 55%."Our performance in Q1 demonstrates the strength of our enterprise AI capabilities, the success in client consolidation decisions, and the dedication of our over 300,000 employees”, said Salil Parekh, CEO and MD. Like the others in the cohort, Infosys raised the floor of FY26 revenue guidance floor to a range of 1% to 3%, from prior 0% to 3%, with margin guidance unchanged despite commentary of “headwinds of lower growth, fixed costs to play out, impact of wage hikes, and large deals will ramp up costs”.
The numbers we track: Infosys
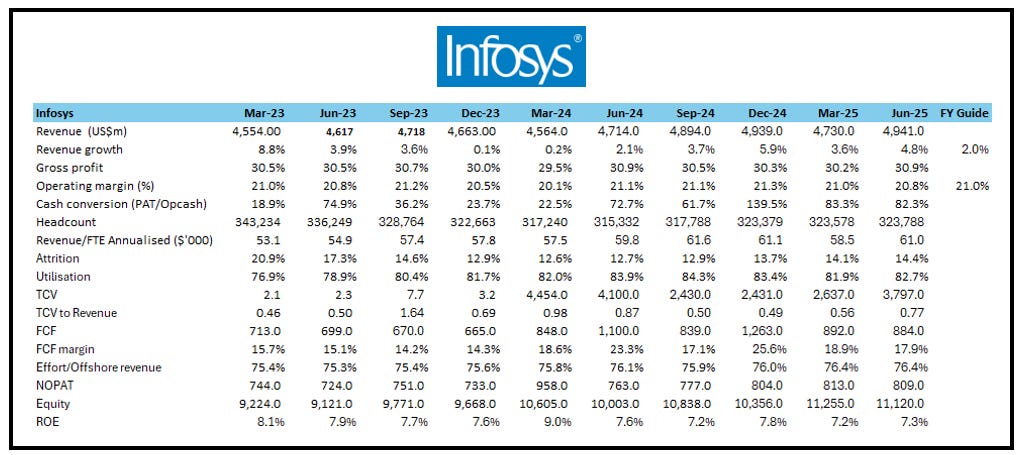
Source: Company data, Technology Investment Services
Mastek. Shares responded very positively (+9% on the day) following results which saw revenue grow 10.4% Y/Y and profit recover (see below). CEO Umang Nahata concluded that the growth was led by strong performance in the UK and Europe (healthcare and government services) and while the US business had headwinds in some accounts the pipeline and order backlog “remain strong”. Note the decline in FTEs in India and the recovery in T%M – both which were a surprise to us as managing the staff pyramid also means keeping FTE costs lower, but also no evidence of the ‘outcome-based pricing’ which we have discussed previously. The 12-month order backlog growth was a function of demand across Digital Engineering and Data, Automation & AI. Oracle-led engagements in healthcare and commercial sectors continuing to scale. AI had “over 10 deals finalised this quarter across generative and agentic AI solutions” and these delivered “significant productivity gains”.
The numbers we track: Mastek
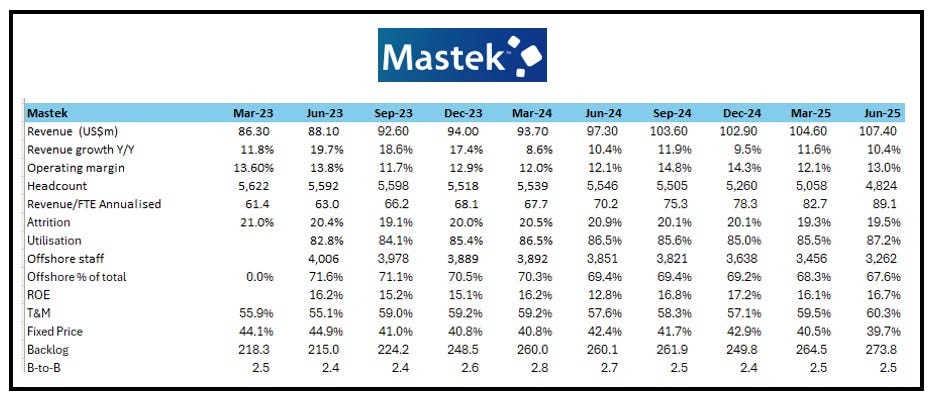
Source: Company data, Technology Investment Services
Tietoevry. Q2 revenue growth -4% Y/Y, and yet somewhat paradoxically a strong order book +14% Y/Y. “Market conditions have remained challenging in IT services”. However the bottom end of guidance increased (from -3% to -2%) with the range of -2% to +1% with the lower end of the range assuming market uncertainty continues in H2, but acknowledges that FY visibility is weak and “macroeconomic uncertainty has increased”. There is another downsizing programme aiming for EUR75m savings by the end of 2026 which sees c.450 FTEs exiting. This is a continuation of the H1 efficiency measures aimed to reduce its workforce by c.800. By the end of 2026, the aim is to achieve total run-rate savings of up to EUR115m with 2024 as the baseline. Costs are expected to be c.3% of revenue.
The deal to sell the Tech Services business to funds advised by Agilitas Private Equity LLP is expected to close in Q3, subject to fulfilment of certain closing conditions. Upon completion, Tietoevry will comprise:
Tietoevry Create (42% of Group): Design, software engineering, data and AI expertise.
Tietoevry Banking (31%): Fintech software-based solutions proven in the Nordics
Tietoevry Care (12%): Open modular data-driven care software and platform to other European markets beyond the Nordics
Tietoevry Industry (14%): Vertical software and data platforms.
The numbers we track: Tietoevry
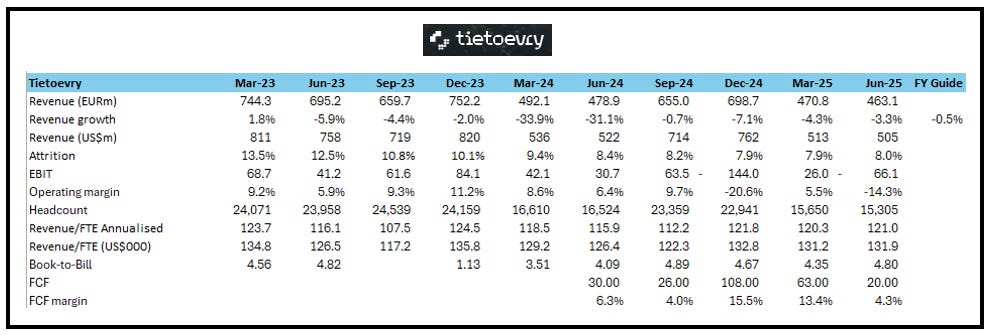
Source: Company data, Technology Investment Services
IBM. Q2 consulting revenue was +2.6% Y/Y with also growth in the operating margin to 10.6%. A very pleasing GenAi outturn with bookings up to US$7.5bn (although not a direct apples-to-apples compare the latest quarter at Accenture featured US$1.5bn GenAI bookings). The consulting group results were part of a broader ‘beat and raise’ quarter at IBM.
The numbers we track: IBM
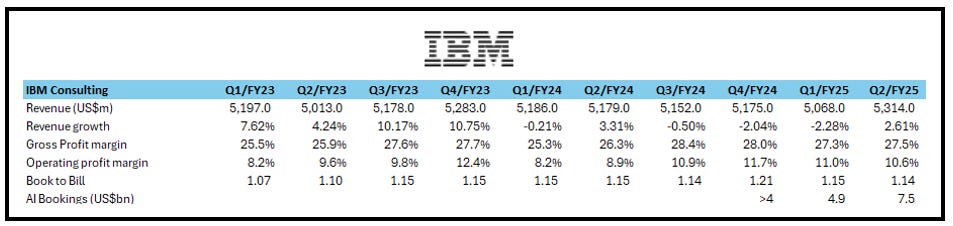
Source: Company data, Technology Investment Services
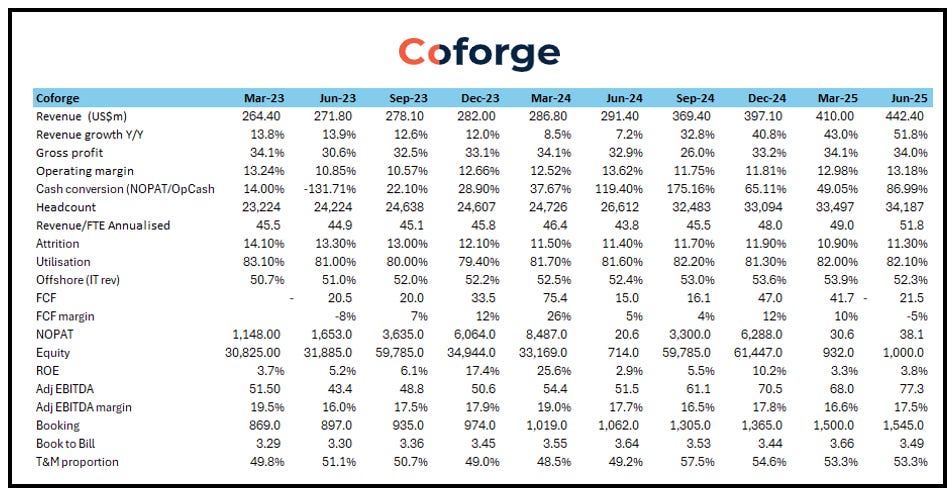
Coforge. A good print with some sparkles like the US$507m Order intake during the quarter as the company inked five large deals making the 12-month Order book of US$1.55bn – that is +46.9% Y/Y. Coforge said that the sales momentum was a function of its “execution-first” culture, hyper-specialisation in select industries (travel, insurance, and healthcare) and deep engineering capabilities. As usual, large contracts will usually burn cash in the initial stage and so FCF drifted lower – and in response the shares were sold, down 9% on the day. CEO Sudhir Singh said that the Quasar AI marketplace had “over 100 case examples of industry-specific solutions”, which he added were not PoCs.
Given our previous comments on how AI changes the T&M business model we were interested in CEO commentary about how clients are shifting from ‘run the business’ to ‘grow the business’ budgets, defined as:
‘Run’ contracts are about measurable efficiency, issued via RFPs but are margin-dilutive as they are “highly contested” and come with price pressures.
‘Growth’ contracts are broader, more strategic, focused on business outcomes. These are more transformative need “deep industry insight and on-ground solutioning teams. They’re more value-led and rate-agnostic”.
While we agree with the sentiment, we note that T&M as a proportion of revenue was flat sequentially at 53.3% (the rest is fixed price) and this increased from 49.2% Y/Y – so this remains more of a talking point rather than ‘in the numbers’ at this stage.
The numbers we track: Coforge
Source: Company data, Technology Investment Services
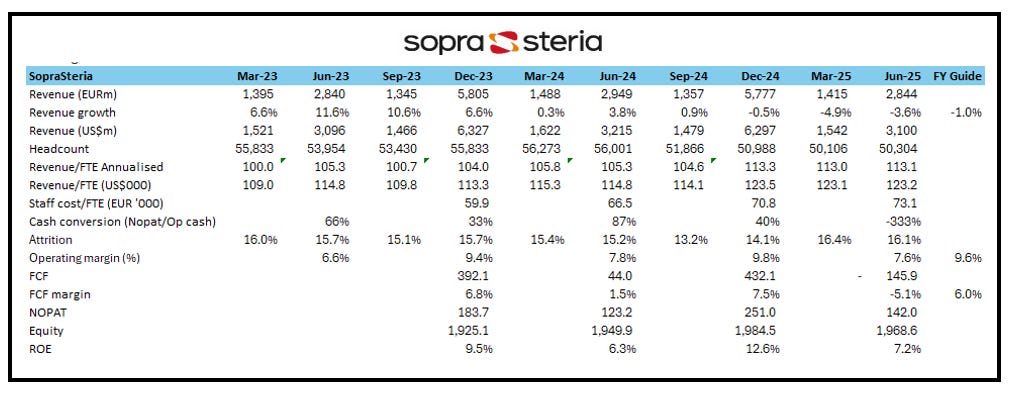
Sopra Steria. H1 revenue, €2,843.7m, -3.6% Y/Y, but there was a sequential improvement with Q2 -2.7% vs -4.9% in Q1. H1 FCF was -€145.9m, €44m a year ago. Net debt, €696.8m, 1.17x pro forma 12-month rolling EBITDA down from 1.63xlast year. Note: Attrition increased to 16.1% from 15.1% last year – by contrast the cohort rate 13.9% Q2 YTD is down sharply from 19.4% last year. The company reiterated FY guidance (revenue -1%, EBIT margin 9.6%, 6% FCF). CEO Cyril Malargé spoke of the “difficult backdrop” but reminded that the company is not directly exposed to the effects of the trade war and has a strong presence in the defence and public-sector. There is some sequential positive news with the low point being Q1 and the customer ‘wait-and-see’ in the public sector (France in particular is “gradually easing”). The strategy is to position Sopra as a trusted, credible European alternative, harnessing technology, generative AI and agentic AI. The shares were marked down, -2.6% in early trading. From the divisions:
France (42% of Group): Revenue -3.7% Y/Y, most verticals reported negative growth during Q2.
UK (16% of Group): Revenue -7.7% Y/Y, but good sequential progress with Q2 -4.7% vs -10.8% in Q1.The NS&I programme got off to a good start on 1 April. The NHS SBS platform saw a significant increase in business activity. Organic revenue growth is forecast for the end of H2.
Europe (36% of Group): Revenue -3.1% Y/Y with revenue growth in Spain, Italy and Scandinavia and most countries in the reporting unit saw profitability decline.
Solutions (6% of Group): Revenue grew 2.6% as the Human Resources Solutions business (64% of the unit’s revenue) grew 2.7% as the Operating margin increased to15.2%, 7.6% in H1 2024.
The numbers we track: Sopra Steria
Source: Company data, Technology Investment Services
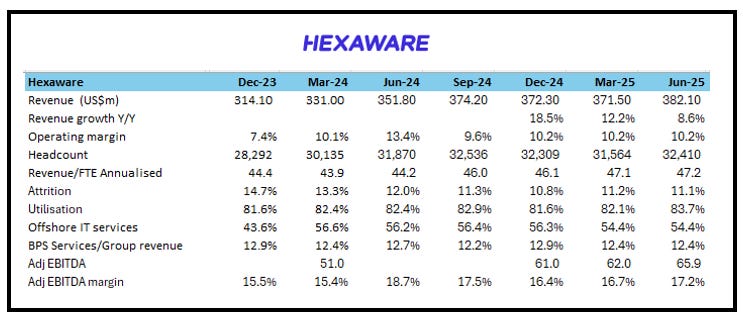
Hexaware. Revenue grew 8.6% with some very strong vertical market growth rates with Financial Services +15.7% Y/Y, High Tech and Professional Services +14.1% and Travel and Transportation +23.4% Y/Y, with a fall in Manufacturing and Consumer -11.5% Y/Y. CEO R. Srikrishna talked about a “difficult global macro environment” and given the continued softness and slow decision making, Hexaware lowered FY expectations. Shares were down c.6% on the news.
Of note. Hexaware acquired SMC for US$90m. For the past decade SMC has built 30+ global capability centers clients like Fortune 500 companies, multinationals, and high-growth startups - all revenue is from US based customers. Revenue was US$22m from c.500 employees and delivery centers in Bengaluru and Hyderabad. According to Nasscomm research the India GCC market which is expected to be worth US$100bn by 2030. The plan is to build a ‘GCC 2.0’ combining SMC with Hexaware’s platforms-led delivery model to deliver world-class and future-proof GCC operations.
The numbers we track: Hexaware
Source: Company data, Technology Investment Services
UK Software
Aptitude. A cautious Trading Update ahead of results (6 August) with deal slippage. ARR edged up 3% Y/Y following “expected churn from legacy products and clients”, which is now being “actively addressed through significant investment in account management”. which is driving improved customer experience. The Group remains confident that churn will reduce from 2026 onwards. Macroeconomic uncertainty has led to the deferral of some notable new opportunities. Guidance is that H1 2025 operating profit will show double digit Y/Y growth. Caution is telegraphed with statements that FY25 revenue is expected to be “broadly in line” with expectations and the company is confident that the Group will meet its “current profit expectations” for FY 2025. Cash £23.7m, £24.4m a year ago following the £6.3m share buyback.
The numbers we track: Aptitude
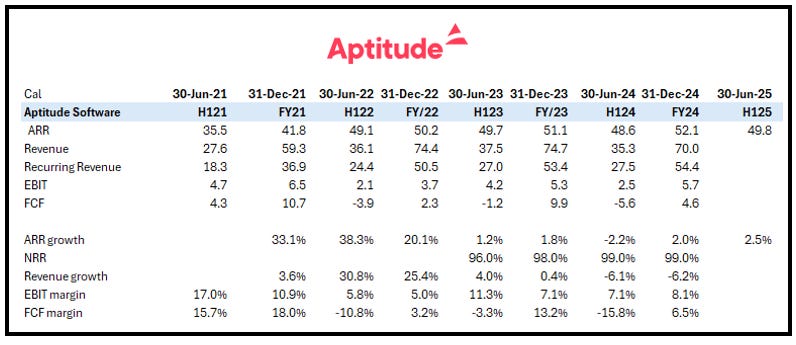
Source: Company data, Technology Investment Services
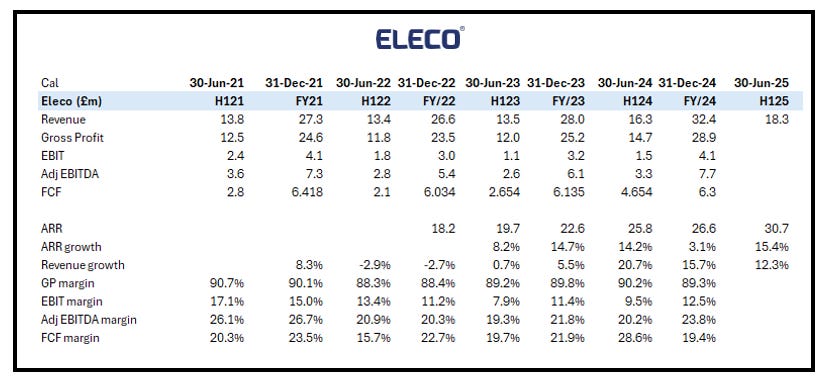
Eleco. One of the UK smaller cap All Stars, Eleco issued a trading update (six months to 30 June) which communicated that trading was in line with FY expectations. ARR +19% Y/Y, revenue +13% Y/Y to c. £18.3m, cash £12.2m, vs £12.0m Y/Y. CEO Jonathan Hunter strikes a cautious tone commenting that “construction markets have continued to experience deferred pipelines which in turn have reduced growth in our one-off services and training income”. The caution prompted some profit-taking.
The numbers we track: Eleco
Source: Company data, Technology Investment Services
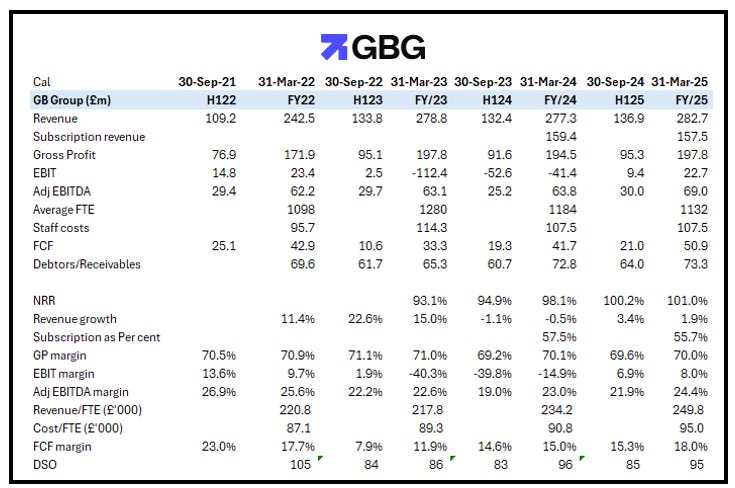
GB Group. A ‘no worries’ AGM statement reminding of the strong operational progress by the new team (agreed). Q1 trading is ‘in line’ and the FY revenue outlook is unchanged “remains consistent with current market expectations”. FX translation will be a headwind to reported revenue growth, but as a caution adds that “the majority” of this impact already reflected in current expectations. Following the pack (after a big lag) there is a new £25m share buyback programme (for us there is a better use of cash at this stage of the cycle), and a move from AIM to the Main Market by early November 2025.
The numbers we track: GB Group
Source: Company data, Technology Investment Services
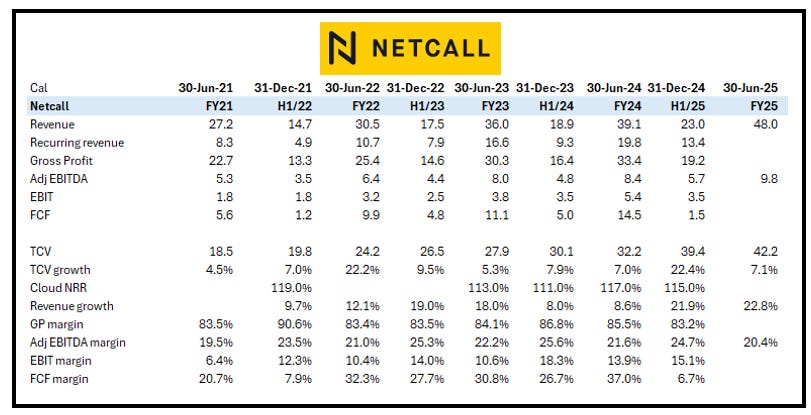
Netcall. An FY Trading Update says that FY results are in line with consensus. The results illustrate the positive effects of acquisitions. FY revenue +23% to £48.0m with 10% organic growth. Adj EBITDA+17% to £9.8m. Strong demand for the Liberty Cloud platform pushed Cloud ACV to £33.9m, which was 26% organic growth and Cloud now accounts for 80% of total ACV, which grew by 31% to £42.2m. This followed a “notable uplift” in new customer wins, particularly in the Public Sector. Year-end cash £27.2m, £34.0m last year following £12.5m acquisition-related payments. CEO James Ormondroyd, Chief Executive, commented: "As we enter the new financial year, we do so with a strong base of recurring revenue, a record pipeline, an increasingly powerful platform and supportive market tailwinds, which together with a healthy cash position, leave us well positioned for the next stage of growth."
The numbers we track: Netcall
Source: Company data, Technology Investment Services
IaaS
Google. Q2 results gave comfort for those investors anxious as to whether the latest US market rally would be sustained by the Mag 7 results, and on a company-specific basis would Google get left behind in search, advertising or LLMs (also on the tape was Tesla which similarly ‘beat the street’ but its concerns remain due to the loss of the ‘green’ subsidies, impact from Chinese rivals, and the Elon factor). Google was first of the Mag 7 cohort to report and while the share drifted lower (c.1%) in the immediate aftermath, revenue was ahead of expectations in an overall very strong Q2 print. Q2 gave investors comfort on search and the viability of the ‘Big Bets’.
Our interest is Google Cloud where revenue soared +32% Y/Y to US$13.6bn “led by growth in Google Cloud Platform across core GCP products, AI Infrastructure, and Generative AI Solutions”. Sundar Pichai, CEO, said: "AI is positively impacting every part of the business, driving strong momentum. Search delivered double-digit revenue growth, and our new features, like AI Overviews and AI Mode, are performing well”. Google is increasing CapEx in 2025 to c.US$85bn.
Google Cloud’s revenue, reignited growth & profit surges
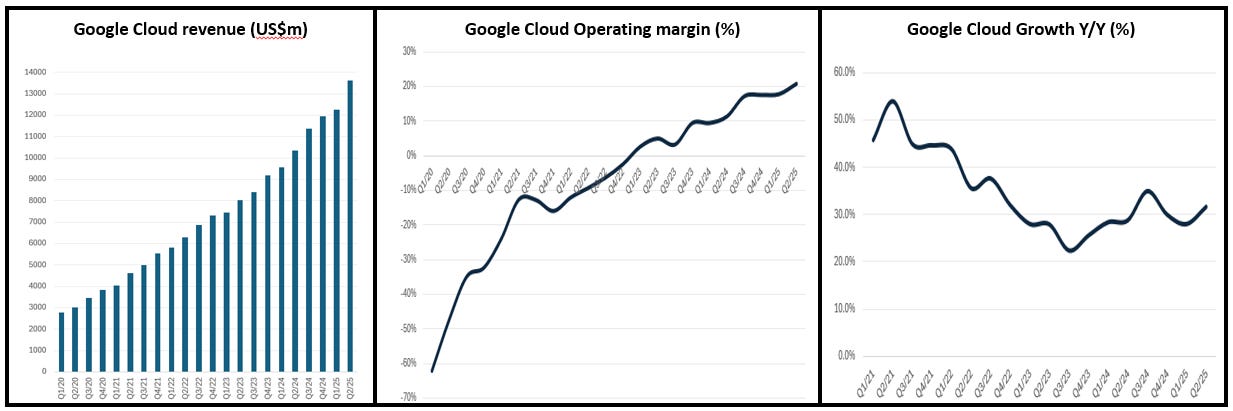
Source: Company data, Technology Investment Services
Iomart. Numbers in line with the prior Trading Update. Cloud services revenue -7% Y/Y due to previously reported churn in self-managed and certain private cloud managed services. Chair telegraphs ongoing restructuring and the revenue was flattered by the Atech acquisition, contributed £21.5m revenue. Good news is that the company has a better ‘sense’ of itself but FY26 continues the restructuring. Net debt increased to £101.9m (31 March 2024: £42.3m) following the £57m cash outflow for Atech, proforma net debt ratio c.2.7x. The Board foregoes the payment of a final dividend, with future dividends restored based on improved operating profitability and a reduced overall level of indebtedness. Actions to deliver £4m annualised cost savings with c.40% of the anticipated savings identified and actioned in Q1 FY2026. Executive Chair Richard Last, commented: “Our focus for FY26 will be to improve the operating efficiency of the Group, address churn in our self-managed and private cloud customer base, increase sales momentum in high-growth service areas, including providing Atech with the support to flourish, and to reduce our level of debt”.
The numbers we track: Iomart
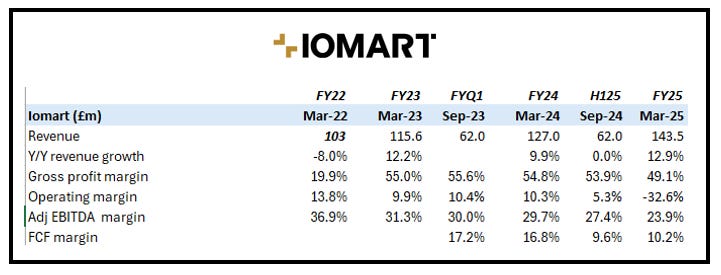
Source: Company data, Technology Investment Services
Digital Realty. A workman-like Q2 featuring revenue, US$1.49bn (consensus was US$1.44 bn) +10% Y/Y, Adj EBITDA, US$823m +13% Y/Y and Funds From Operations (FFO) US$600m, US$1.75/share vs US$1.57/share last year. President/CEO Andy Power commented: "Record bookings in our 0–1 megawatt plus interconnection product set underscore the strength of our full spectrum strategy and the breadth of the growing demand for digital infrastructure". With the inaugural US Hyperscale Data Center Fund over-subscribed (>US$3bn LP Equity commitments and >US$900m Gross Proceeds realised in 2Q), Digital Realty has the capital to extend the footprint, current 300 data centers.
The numbers we track: Digital Realty
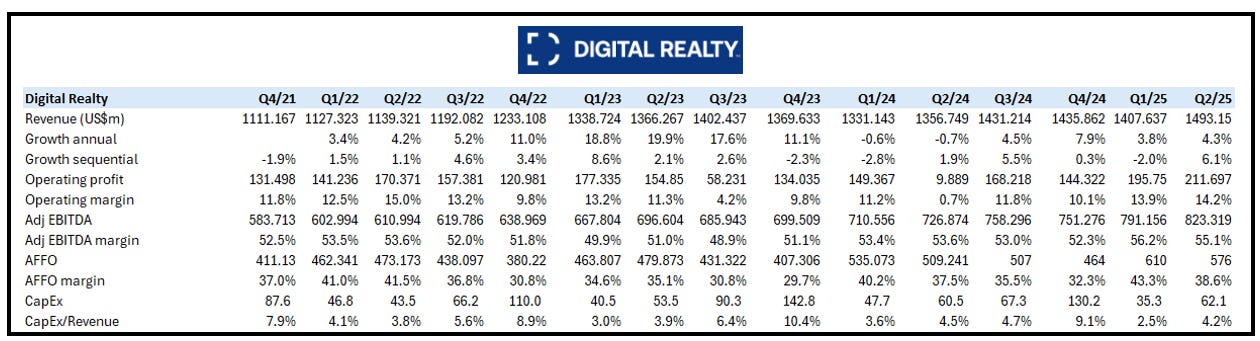
Source: Company data, Technology Investment Services
Managed Services
SysGroup. FY results are in line with the prior trading update, and reflect a company in the midst of Strategic Repositioning: as it morphs from legacy hosting and resale into a consultative, solutions provider “at the intersection of cybersecurity and AI”. The company is not through the change yet, FY revenue, £20.5m, was down from £22.7m last year. The revenue fall was due to churn, the down sell of managed services contracts and low margin value add resale. Positively, the YTD FY26 churn rate has “significantly reduced” with sequential growth in managed services for the last two quarters.
Shares were down 10% on the market opening responding to the cautious market prognosis by Exec Chair Heejae Chae. Mr Chae commented that near term, macroeconomic and geopolitical uncertainties continue to create a more complex and unpredictable outlook. In Q1 there was a “significant slowdown of discretionary spend both in professional services and value-added resales, with customers postponing capital investment decisions”. However, more positively, there was growth in managed services for “the first time in two years” and there is “a recovery in pipeline activity”, but decision-making cycles among SMEs continue to show signs of caution, particularly for discretionary or transformational IT investments.
The numbers we track: SysGroup
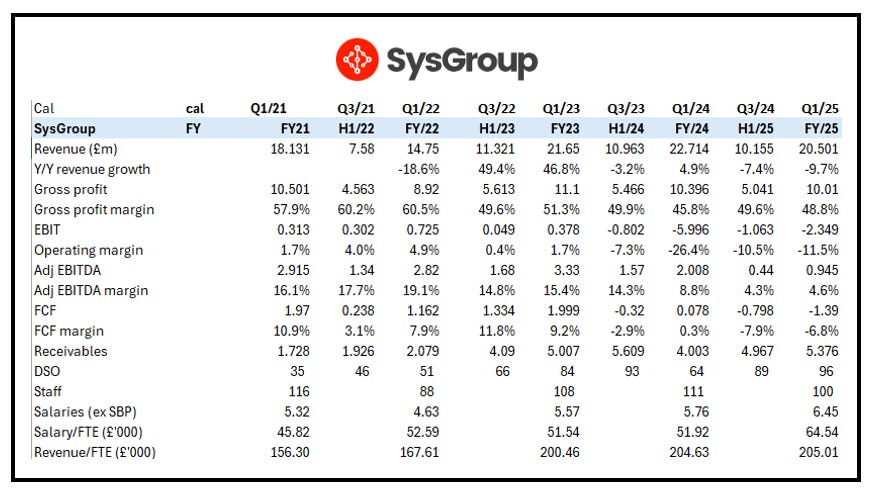
Source: Company data, Technology Investment Services
Recruitment
Robert Half. Pleasingly, revenues and earnings were in line with the midpoint of our prior guidance. Q2 global enterprise revenue, US$1.370bn, was -7 % Y/Y as the “elevated global economic uncertainty persisted throughout the quarter, extending client and job seeker caution, elongating decision cycles, and subduing hiring activity and new project starts”. Positively, President/CEO M. Keith Waddell commented that revenue in the first two months “stabilized at lower levels in June, which continued post-quarter into July”. Fears of economic recession have eased as worst-case trade policy concerns have not materialised, and proposed tax changes have now become law. “Small business confidence levels have also rebounded modestly from recent lows”.
In its pre-prepared remarks the company said that the US unemployment rate for college-educated professionals is holding steady at just 2.5 percent, with even lower rates prevailing among specialised accounting, finance and technology roles. Although current hiring and quit rates “remain subdued”, job openings continue to be well above historical levels, indicating strong pent-up hiring demand. As business confidence improves, there is a corresponding acceleration in hiring urgency, project demand, and the reprioritization of previously deferred initiatives. This natural progression typically places increased demands on client resources that are “already operating at or near capacity, creating the hiring and consulting environment that has historically driven substantial growth for our business during the early phases of economic expansion cycles”.
The numbers we track: Robert Half
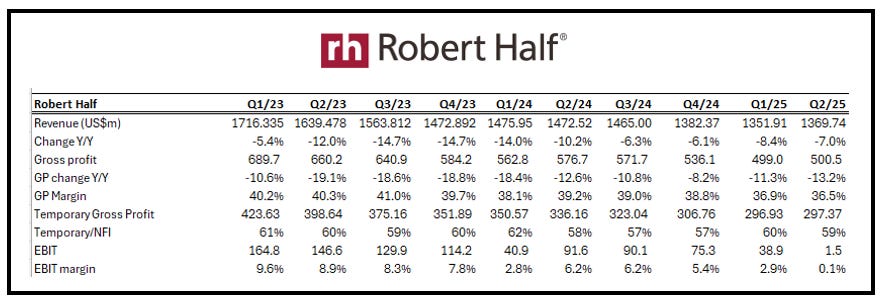
Source: Company data, Technology Investment Services
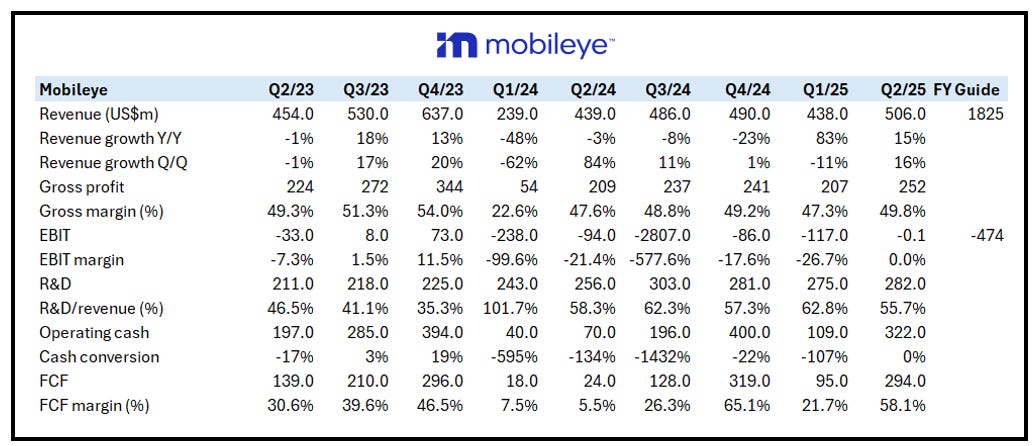
IoT/Smart
Mobileye. Q2 revenue growth, 15% Y/Y, beat guidance; it was a huge quarter for cash generation with operating cash US$322m and the company raised FY guidance but shares were sold off (-c.6%) in the aftermath. Positive proof-points on consumer acceptance of driverless robotaxis is driving (pun just slipped out) demand for the Mobileye Drive system, both from the vehicle platform side (OEMs) and the demand-generation side (mobility providers). The lead vehicle platform provider (Volkswagen) announced a strategic partnership with Uber to deploy robotaxis beginning in Los Angeles. The company made progress on completing the ecosystem for the Lyft / Marubeni engagement, and it continues to see strong interest from mobility providers across Europe.
“Stronger visibility on industry supply-demand alignment since late-April supports our decision to raise the full-year outlook, while we continue to maintain a conservative stance given the broader macro environment,” said Mobileye President and CEO Prof. Amnon Shashua. Mr Shashua added that the substantial progress on advanced product programs raises confidence that upcoming launches will “lead to an inflection in Mobileye’s growth trajectory in 2027, with Drive anticipated to join SuperVision as material growth drivers in that year.”
The numbers we track: Mobileye
Source: Company data, Technology Investment Services
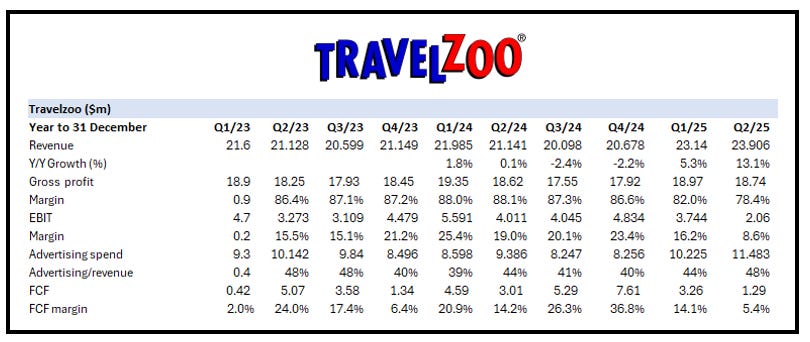
Travel-Tech
Travelzoo. Travelzoo is a club for travel enthusiasts where members receive Club Offers from a range of “thousands of top travel suppliers”. Travelzoo members are older (60% 45+ years), predominantly female (61%) and affluent (21% are household income >US$200k) (and don’t mind being called animals). We include it with our OTA group because it has some similarity with the general direction that Hostelworld appears to be taking.
Q2 revenue grew 13% Y/Y, but EBIT shrank as Travelzoo invested in customer acquisition. As a subscription business, membership fee revenue is ‘over time’, acquisition costs are ‘as incurred’, hence the profit slump. Unfortunately, Travelzoo does not disclose membership data so we cannot ascertain CaC but it claims to “reach 30m travelers” (and has done for a while). Revenue is predominantly from advertising and commerce but last year Travelzoo introduced a membership fee (US$40 for 12-months) and now guides that membership fees have started to “drive significant revenue growth”. Next year members are expected to account for c.25% of revenue.
The print was shy of expectations. The share price responded in kind.
Like Hostelworld, and our Social cohort before it, the people/community/membership industry spent Q1 and Q2 investing in customer acquisition. While there is an element of seasonality, ‘bears’ will wonder if this reflects a deeper secular move around the end of the post-Covid ‘get me out of here’ trend.
The numbers we track: Travelzoo
Source: Company data, Technology Investment Services
Dear investor,
Thank you for reading to the end. Don’t forget to subscribe if you haven’t already!
Join me again soon.
Best wishes
George
End notes & Disclaimer: Please read
All information used in the publication of this report has been compiled from publicly available sources that are believed to be reliable, however we do not guarantee the accuracy or completeness of this report and have not sought for this information to be independently verified. This is not investment advice. Opinions contained in this report represent those of the author at the time of publication. Forward-looking information or statements in this report contain information that is based on assumptions, forecasts of future results, estimates of amounts not yet determinable, and therefore involve known and unknown risks, uncertainties and other factors which may cause the actual results, performance or achievements of their subject matter to be materially different from current expectations. The author is not liable for any direct, indirect or consequential losses, loss of profits, damages, costs or expenses incurred or suffered by you arising out or in connection with the access to, use of or reliance on any information contained herein. The information should not be construed in any manner whatsoever as, personalized advice nor construed by any subscriber or prospective subscriber as a solicitation to effect, or attempt to effect, any transaction in a security. Any logo used in this report is the property of the company to which it relates, is used here strictly for informational and identification purposes only and is not used to imply any ownership or license rights between any such company and Technology Investment Services Ltd. Email addresses and any other personally identifiable information collected in the provision of the newsletter are only used to provide and improve the newsletter.
Need more
Let’s chat at Progressive Equity Research where I am delighted to be a contributing analyst and my website.
The ask
My name is George O’Connor. I am a tech investment and IT industry analyst. I explore shareholder value, its drivers, the best exponents, the duffers. The target readers are investors, companies, advisors, stakeholders and YOU. If you like this please subscribe and pass it on to colleagues and friends. That said, if you hate it - do the same. Thanks for dropping by dear investor.